Solana (SOL) in Focus: Consolidation Phase Hinting at Upcoming Highs?
03/29/2024 17:45
Explore how SOL price trends, driven by robust user activity and soaring TVL, signal a promising future for investors.
Since peaking on March 17, Solana has maintained a unique user count consistently above 800,000, signaling a strong community engagement that reflects positively on the Solana (SOL) price. Daily DEX trades on the blockchain remain high, underscoring sustained active participation.
While the outlook for Solana remains bullish, it’s anticipated that the current consolidation phase may persist a bit longer before the token experiences a significant uptick once again.
Solana Total Value Locked Remains Above $4 Billion
Recently, the Solana ecosystem has achieved a noteworthy achievement by surpassing the $4 billion mark in Total Value Locked (TVL) for the first time since April 2022. This mark was reached on March 15, and since March 22, Solana TLV has remained above $4 billion.
This significant metric, which tallies the aggregate value of assets deposited across decentralized finance (DeFi) platforms within Solana, serves as a critical indicator of the ecosystem’s overall health, the effectiveness of its DeFi applications, and the degree of user engagement. The recent uptick in TVL shows a revival of investor confidence and an escalating interest in the DeFi offerings available on Solana.
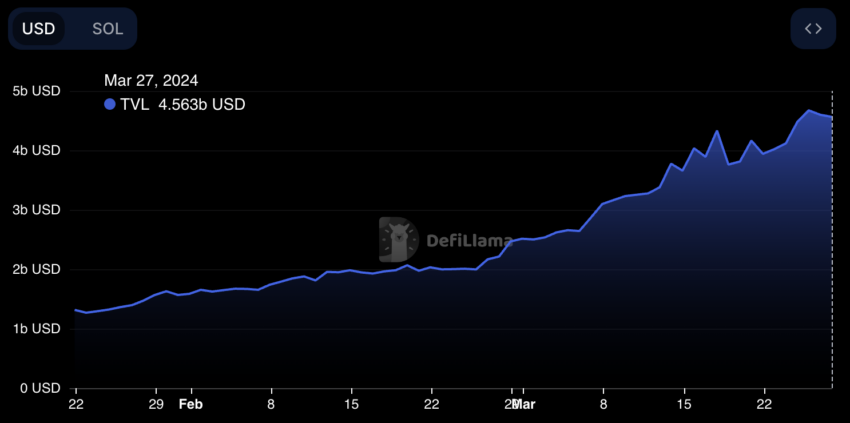
Historically, Solana’s TVL reached its peak in 2021, with figures soaring above $10 billion. This period of exponential growth was followed by a marked decrease, leading to a considerable contraction in TVL. The span from November 2022 to November 2023 saw the TVL fluctuating within the range of $250 million to $350 million, indicating a phase of stabilization and consolidation for the Solana ecosystem.
This phase was crucial in laying the foundation for the subsequent revival, as it reflected a period of equilibrium that ultimately paved the way for the current surge in DeFi activity on Solana.
Read More: Solana vs. Ethereum: An Ultimate Comparison
Solana Users and DEX Trades Remain Strong
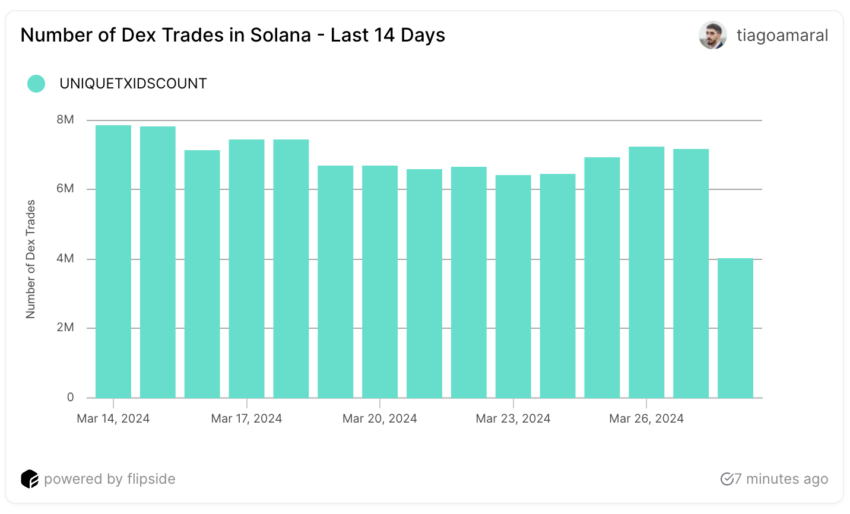
A notable event was the unprecedented daily volume of Decentralized Exchange (DEX) transactions, reaching a record 7.86 million on March 14, setting a new high. From March 14 onwards, Solana’s DEX trading volume consistently exceeded 6 million transactions daily, a stark contrast to the period before December 2023 when daily transaction volumes peaked at 2.2 million on Solana DEXs.
Between March 19 and 24, unique daily DEX trades were always around the 6 million zone. Then, it started to grow again, reaching more than 7 million from March 25 to March 27.
Another metric drawing attention from Solana’s on-chain analytics is the Daily Unique Transaction Signers, which gauges the number of unique users transacting on the network each day.
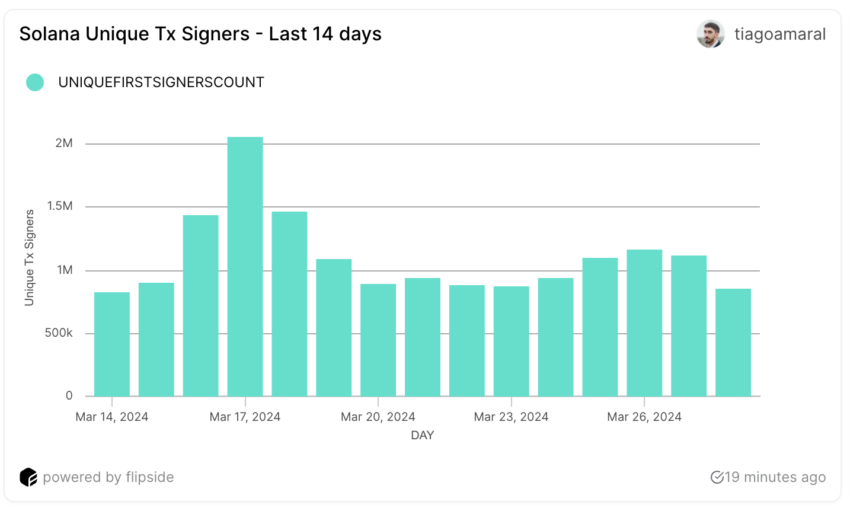
Starting in January 2024, there’s been a consistent rise in this metric. It reached 823,000 users by March 14 and soared above 2,000,000 by March 17. That represents an increase of 143% in just three days. Yet, after surpassing 2,000,000 daily unique users, the count of daily signers began to diminish, dropping to 936,000 by March 21. After some consolidation, that number started to rise again.
Solana registered 873,000 unique users on March 23, and that number grew to 1.1 million on March 27.
SOL Price Prediction: EMA Lines Are Drawing a Consolidation
The SOL 4-hour price chart clearly indicates the 20 EMA line nearing a dip below the 50 EMA line. EMAs, more responsive than SMAs, adeptly reflect market trends by weighting recent price movements, crucial for identifying trend directions and reversals.
When the shorter-term 20 EMA crosses under the longer-term 50 EMA, it typically signals a shift towards bearish momentum. This movement often ushers in a consolidation phase, where prices stabilize as the market reaches equilibrium between buyers and sellers.
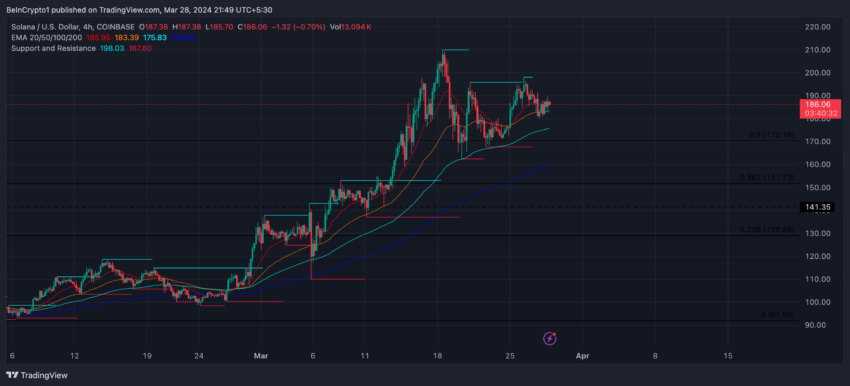
Observing the SOL price chart, it’s evident that while short-term EMAs stand well above the longer-term ones, they are aligning with current price levels. That indicates that SOL is indeed undergoing a consolidation phase.
Read More: Top 6 Projects on Solana With Massive Potential
Should Solana undergo a correction, it may test the $167 support level. If SOL fails to hold, the next potential support is at $137. However, should the bullish momentum resume, this consolidation could serve as a springboard. This would potentially propel SOL back to its journey to a new all-time high. Its previous record is $259.97, reached in November 2021.
Trusted
Disclaimer
In line with the Trust Project guidelines, this price analysis article is for informational purposes only and should not be considered financial or investment advice. BeInCrypto is committed to accurate, unbiased reporting, but market conditions are subject to change without notice. Always conduct your own research and consult with a professional before making any financial decisions. Please note that our Terms and Conditions, Privacy Policy, and Disclaimers have been updated.