Ethereum’s latest ‘fall’ – Should you remain bullish on ETH?
04/01/2024 04:00
Ethereum's reserves on exchanges plunged to new lows, with just about 11% of total supply available for active trading.

- Just about 11% of ETH’s total supply was available for active trading.
- Investors showed less willingness to part with their ETH holdings.
Are you interested in buying Ethereum [ETH] but not getting enough sellers in the market? Well, you might not be the only one!
ETH’s liquid supply dwindles
With an impressive start t0 2024, gaining nearly 57% year-to-date (YTD), and the prospect of a spot ETF looming, ETH might be one of the hottest entities in the crypto market currently.
But demand is not the problem for the king of altcoins. Supply is.
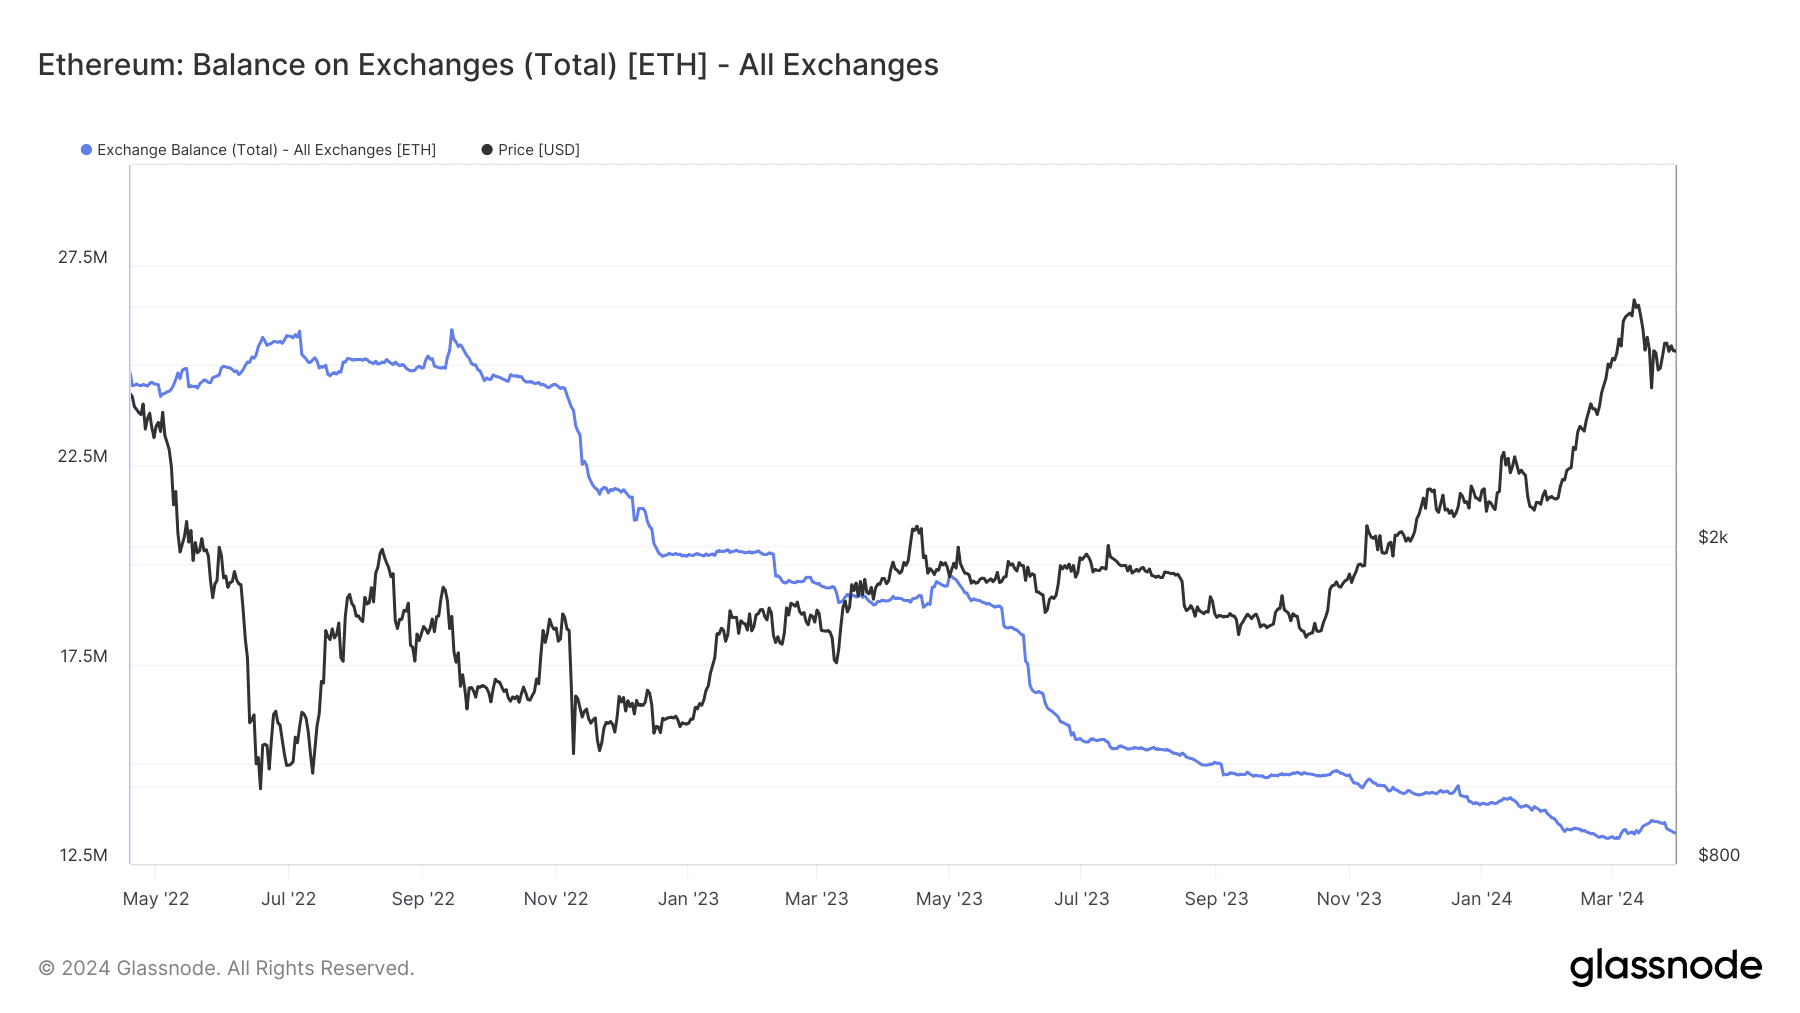
According to AMBCrypto’s analysis of Glassnode’s data, ETH reserves on exchanges plunged to new lows as of this writing.
In fact, just about 11% of total supply was available for active trading, down from 15.8% at this time last year.
The trend has continued in 2024, despite a 57% increase in ETH’s value year-to-date (YTD). If the downward trajectory continues, the supply crunch would aggravate further.
Typically, such shortages help in bolstering prices in the long run, provided demand remains strong.
As evident, the supply plummeted throughout 2022 and 2023, but ETH still underperformed, owing to bear market-induced uncertainties.
However, with improving sentiment regarding cryptocurrencies, coupled with ETH’s own potential bullish catalysts like spot ETFs, the pursuit to grab the second-largest digital asset could only get stronger.
ETH whales busy stockpiling
Whales, who are known for possessing a large chunk of ETH’s supply, seem to be bullish on ETH as well.
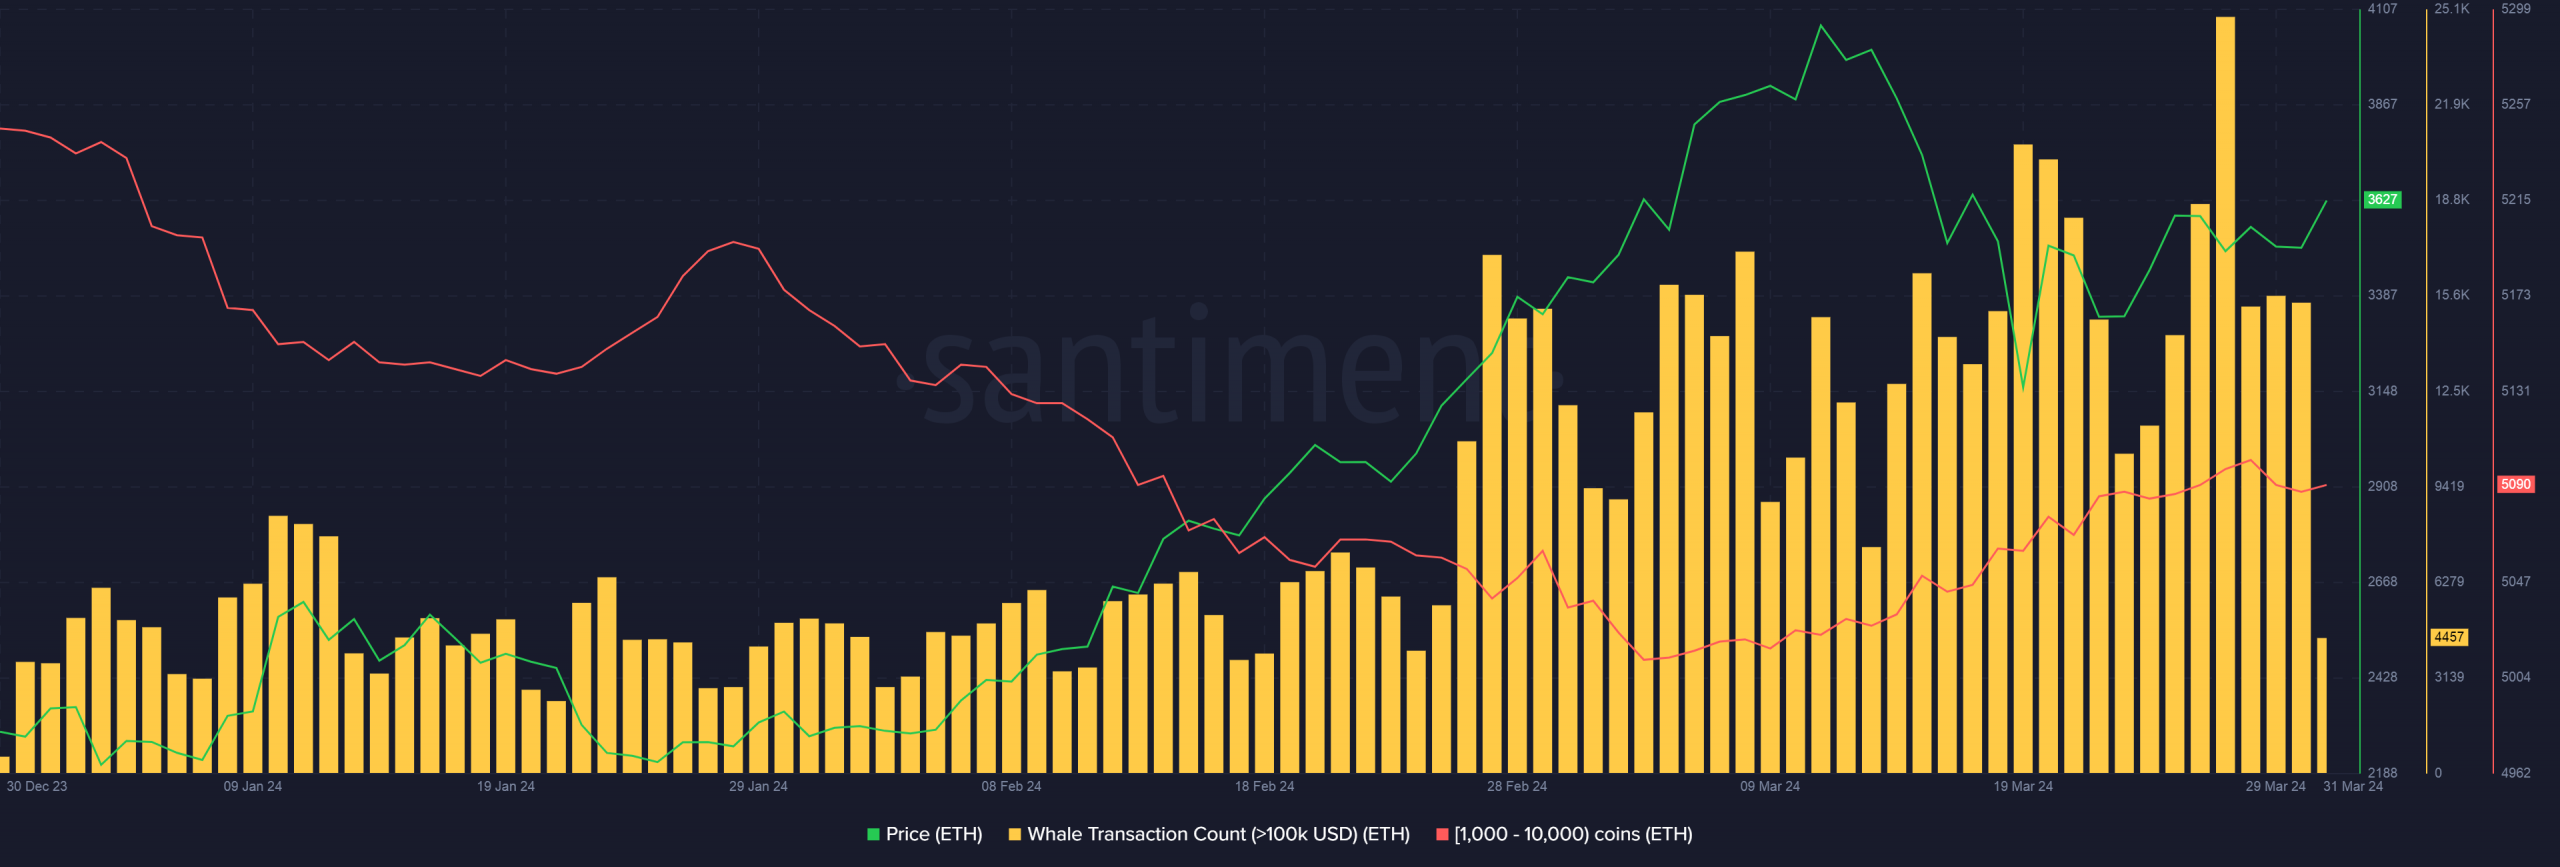
As per AMBCrypto’s analysis of Santiment’s data, whale transactions worth over $100k increased lately despite a price correction.
These transactions led to an uptick in the number of wallets holding between 1,000 to 10,000 coins.
What can you expect from ETH?
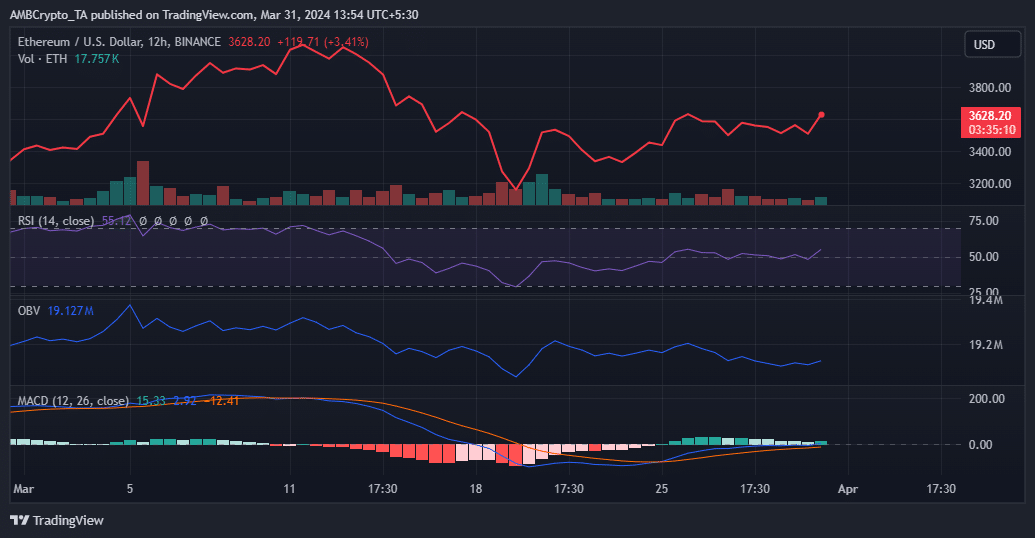
To gain a better view of ETH’s current market state, AMBCrypto analyzed some of its key technical indicators using TradingView.
The Relative Strength Index (RSI) bounced above the neutral 50 line for the first time since mid-March. A move above 60 could consolidate bullish sentiments and pave way for its rise towards $4,000.
That being said, the On Balance Volume (OBV) failed to make higher peaks like price, moved sideways in the last 10 days. This suggested that the uptrend might stall.
Is your portfolio green? Check out the ETH Profit Calculator
Moreover, the Moving Average Convergence Divergence (MACD) was at the risk of going below the signal line in the next few days. Such an event would strengthen bearish narratives.
Conversely, a move above zero could aid in further price gains.


