Toncoin (TON) Whale Holdings Climb to an All-Time High
06/25/2024 16:45
Toncoin’s (TON) price rally in the last month has prompted some large investors to increase their holdings.
It is no longer news that the last month has been marked by a decline in activity in the general cryptocurrency market. At $2.37 trillion as of this writing, the global cryptocurrency market capitalization has dropped by 15% in the past 30 days.
Amid this decline, Toncoin (TON), the cryptocurrency linked to the popular messaging app Telegram, has surged by 20%. Its whales have also increased their accumulation.
Toncoin Whales Open Up Their Bags
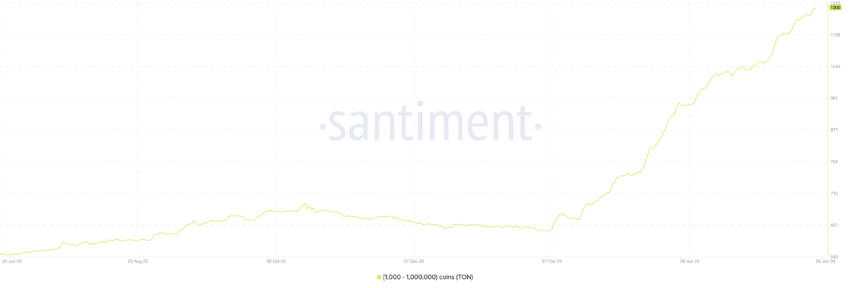
An on-chain assessment of Toncoin’s whale activity revealed an uptick in the last month. The count of TON whales that hold between 1000 and 1,000,000 coins has increased by 15% in the last 30 days.
Currently, this cohort of TON whales consists of 1,200 addresses, marking its highest level ever.

When large holders accumulate an asset during a rally, it often signals strong confidence in the asset’s future potential.
Also, whale buying activity can support an asset’s sustained uptrend. Their purchases can create additional upward pressure on the price, reinforcing the bullish momentum.
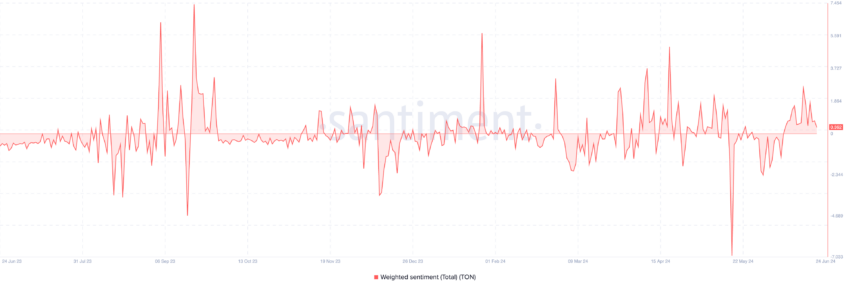
The coin’s weighted sentiment is positive at press time, confirming the bullish bias toward TON. Above zero, its current value is 0.36.
Read More: What Are Telegram Bot Coins?

This metric tracks the overall positive or negative bias in an asset’s mentions on social media. When its value is positive, it means that most of the asset’s mentions on social media express optimistic emotions.
TON Price Prediction: The Bulls Have a Path to Victory
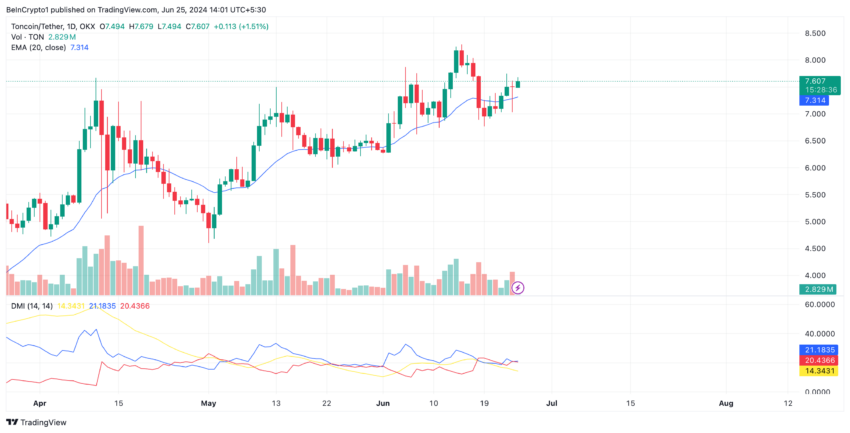
At press time, TON trades at $7.57. An assessment of its price performance on a daily chart shows that it recently crossed above the 20-day Exponential Moving Average (EMA).
An asset’s 20-day EMA measures its average price over the past 20 trading days. When an asset rallies above it, it is a bullish signal confirming the surge in buying pressure.
Further, readings from TON’s Directional Movement Index (DMI) show that the positive directional index (blue) recently crossed above the negative index (red).

An asset’s DMI is used to assess the strength and direction of its market trend. When its positive index crosses above the negative index, it signals a potential buying opportunity. It indicates that the upward movement in the asset’s price is stronger than the downward movement.
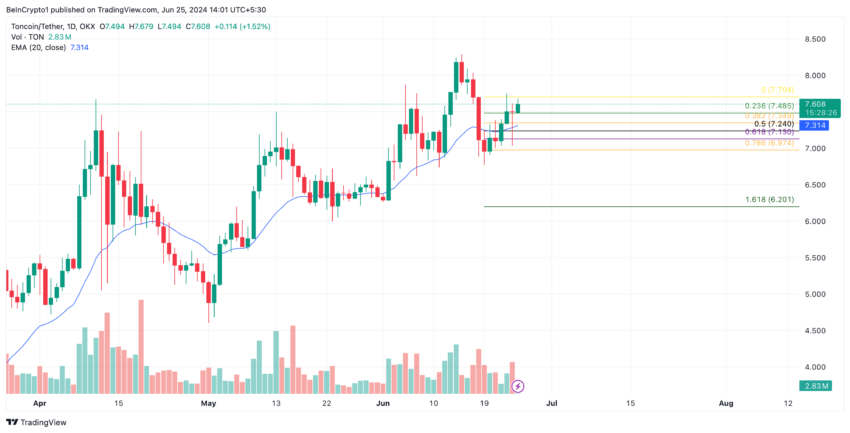
If this trend continues, TON’s value may climb to $7.70.

However, if the recent rally in the coin’s price leads to an uptick in profit-taking activity, this projection will be invalidated, and TON’s price will fall to $7.48.
Trusted
Disclaimer
In line with the Trust Project guidelines, this price analysis article is for informational purposes only and should not be considered financial or investment advice. BeInCrypto is committed to accurate, unbiased reporting, but market conditions are subject to change without notice. Always conduct your own research and consult with a professional before making any financial decisions. Please note that our Terms and Conditions, Privacy Policy, and Disclaimers have been updated.