Celestia (TIA) Plummets to 7-Month Low as Price Struggles to Bounce
06/25/2024 20:45
Celestia has been on a downtrend since the beginning of June. It now trades at a price level last recorded in November 2023.
The value of TIA, the native token of Celestia, a modular blockchain network, has fallen to a price level last observed in November 2023.
As of this writing, the altcoin exchanges hands at $6.82, having shed almost 30% of its value in the past 30 days.
Celestia Traders Look Elsewhere
The fall in Celestia’s value has resulted in a corresponding decline in activity in its futures market. At $81.20 million as of this writing, the coin’s futures open interest has decreased by 37% since the beginning of the month.

On a year-to-date (YTD) basis, the altcoin’s futures open interest has plunged by 44%. At its current level, TIA’s futures open interest is at its lowest since November 11, 2023.
An asset’s futures open interest is the total number of outstanding futures contracts that have not been settled or closed.
When it falls, traders are closing their positions without opening new ones. This is often a bearish signal that hints at reduced market activity and confirms the possibility of a further price decline.
The coin’s double-digit devaluation since June began has led to a series of long liquidations. This is because most of its derivatives traders continue to demand long positions despite TIA’s price decline.
Read More: Top 10 Aspiring Crypto Coins for 2024

However, their positions are forcefully closed as the coin’s price touches new lows. Trades are liquidated when a trader’s position is forcefully closed due to insufficient funds to maintain it.
Long liquidations happen when an asset’s value drops unexpectedly, forcing traders with open positions in favor of a price rally to exit.
TIA Price Prediction: Fall Under $6 Imminent?
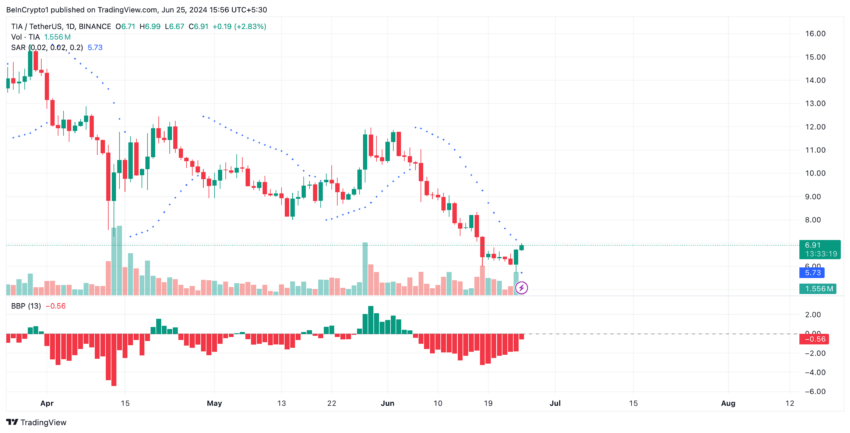
TIA’s negative Elder-Ray Index confirms the bearish sentiment that currently trails the altcoin. At press time, this indicator’s value is -0.55. For context, it has returned only negative values since June 6.
This indicator measures the relationship between the strength of buyers and sellers in the market. When its value is negative, bear power dominates the market.
Further, the setup of TIA’s Parabolic Stop and Reverse (SAR) indicator lends credence to the position above. The dots that make up the indicator are above its price.

This indicator determines the direction of an asset’s price and identifies potential reversal points. When its dots rest above an asset’s price, the market is said to be in decline.
Market participants interpret this as a signal that the price will continue falling, and they should hold short positions or enter new ones.
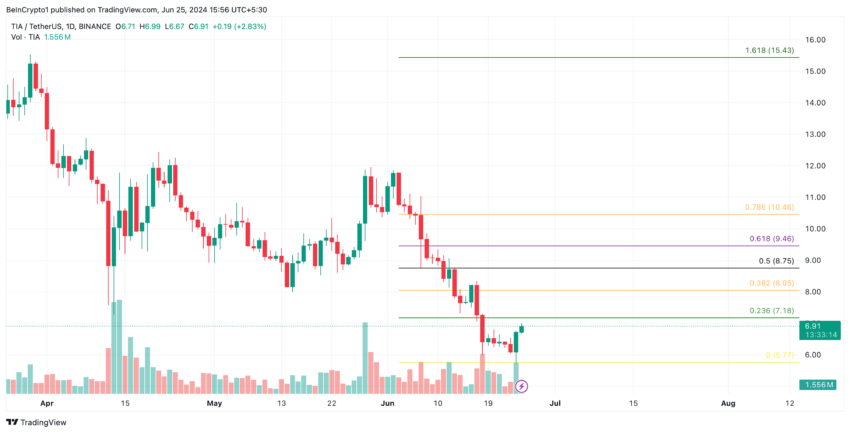
If TIA’s price continues on its downtrend, its value may fall under $6 to trade at $5.77.

However, if the bulls initiate a rebound, the above projection will be invalidated, and the coin’s price will climb toward $7.18.
Trusted
Disclaimer
In line with the Trust Project guidelines, this price analysis article is for informational purposes only and should not be considered financial or investment advice. BeInCrypto is committed to accurate, unbiased reporting, but market conditions are subject to change without notice. Always conduct your own research and consult with a professional before making any financial decisions. Please note that our Terms and Conditions, Privacy Policy, and Disclaimers have been updated.