Binance Coin (BNB) Continues to Trade Below Key Moving Averages
06/26/2024 17:30
Binance Coin (BNB) has witnessed a surge in sell-offs since it rallied to an all-time high of $720.67 on June 6.
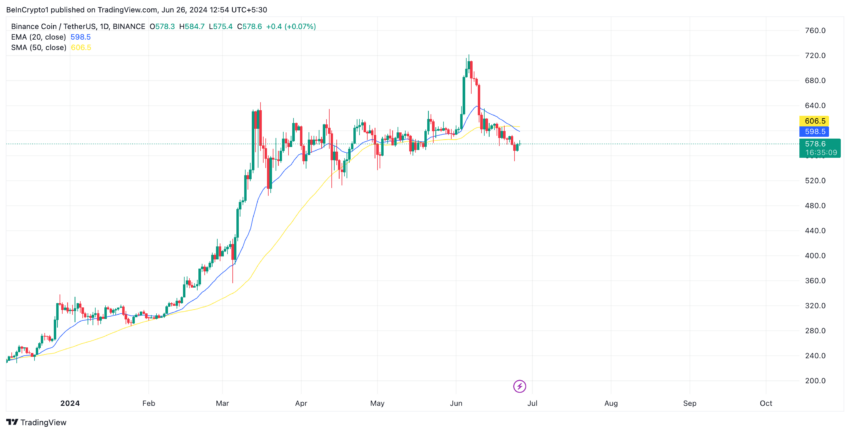
Binance Coin (BNB) has maintained a downtrend since it fell from its all-time high of $720.67 on June 6. Exchanging hands at $576.22 at press time, the altcoin’s value has since plummeted by 24%.
With the steady decline in the coin’s demand, it has continued to trade under its key moving averages.
Binance Coin Falls Short
At its current price, BNB trades below its breakout level of $625 and under its 20-day Exponential Moving Average (EMA) and 50-day Small Moving Average (SMA).

An asset’s 20-day EMA measures its average price over the past 20 trading days. On the other hand, the 50-day SMA tracks the average price of an asset over the past 50 days. While the 20-day EMA identifies an asset’s short-term trend direction, the 50-day SMA tracks the medium/long-term trend direction.
When an asset’s price trades under these key moving averages, it is a bearish signal that suggests a decline in buying momentum. In BNB’s case, it fell below these levels on June 11 and has since remained below them.
Consistently trading below both moving averages confirms a downtrend, indicating that the price will likely continue falling in the near to medium term.
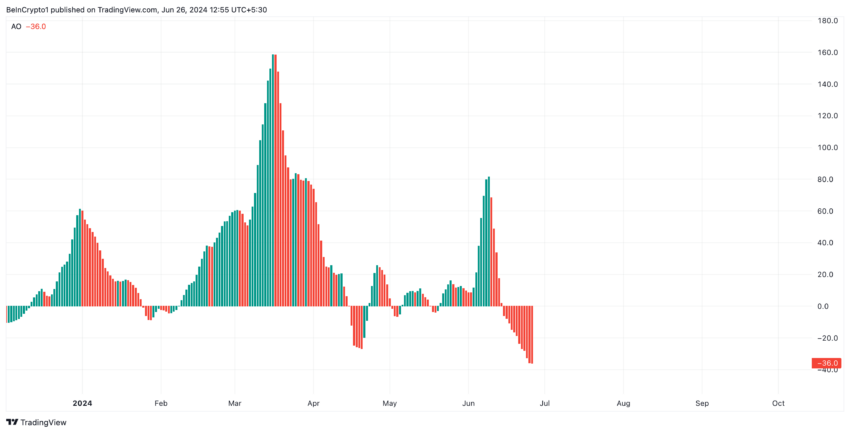
Readings from BNB’s Awesome Oscillator (AO) confirm the possibility of this happening. Since June 10, the indicator has returned only red histogram bars.
Read More: How To Buy BNB and Everything You Need To Know

The indicator measures an asset’s price momentum and identifies potential trend reversals or continuation patterns. When its bars are red, the indicator’s value is negative.
A negative AO value suggests that the market is experiencing a decline, with the short-term trend weaker than the long-term trend. It indicates that the asset’s price is in a downtrend and that selling pressure is stronger than buying pressure.
BNB Price Prediction: Futures Traders Continue to Demand Long Positions
Despite BNB’s price decline since the beginning of the month, its futures market traders have remained resilient. The coin’s aggregated funding rate across cryptocurrency exchanges shows that market participants continue to demand more long positions than short ones.

Funding rates are a mechanism used in perpetual futures contracts to ensure the contract price stays close to the spot price.
When an asset’s funding rate is positive, the asset’s contract price is higher than its spot price, and traders who hold long positions are willing to pay a fee to traders shorting the asset.
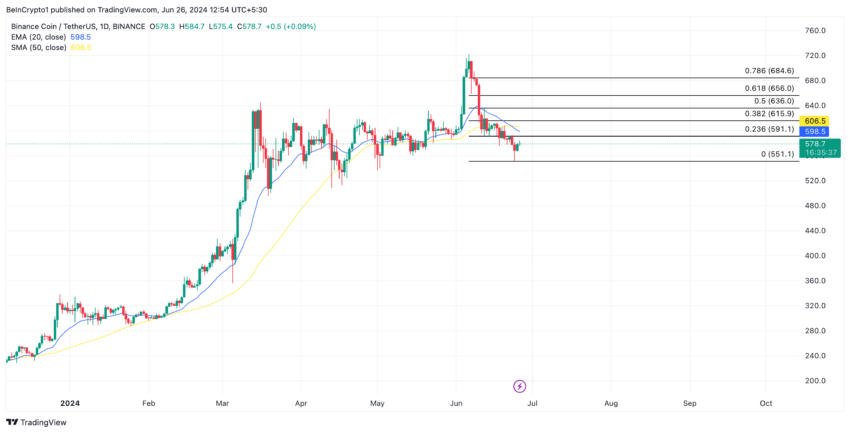
This means that more traders are expecting the asset’s price to rise than are buying it with the expectation of selling at a lower price. If the coin witnesses a shift in sentiment from bearish to bullish, that can drive its price up to $591.
Read More: How To Buy BNB and Everything You Need To Know

However, if the current trend continues and the demand for BNB keeps falling, its price will drop to $551.
Trusted
Disclaimer
In line with the Trust Project guidelines, this price analysis article is for informational purposes only and should not be considered financial or investment advice. BeInCrypto is committed to accurate, unbiased reporting, but market conditions are subject to change without notice. Always conduct your own research and consult with a professional before making any financial decisions. Please note that our Terms and Conditions, Privacy Policy, and Disclaimers have been updated.