Shiba Inu (SHIB) Whales Have Disappeared
07/02/2024 18:19
Number of Shiba Inu whales on market decreasing, followed by relatively stable performance of SHIB

Disclaimer: The opinions expressed by our writers are their own and do not represent the views of U.Today. The financial and market information provided on U.Today is intended for informational purposes only. U.Today is not liable for any financial losses incurred while trading cryptocurrencies. Conduct your own research by contacting financial experts before making any investment decisions. We believe that all content is accurate as of the date of publication, but certain offers mentioned may no longer be available.
Shiba Inu whales are swimming away from the asset, but it might become the good sign we have all been waiting for. The exodus of whales is often considered a sign of dropping volatility. However, it is too early to panic, and the main concern here should mostly be the lack of liquidity. But there are some good signs.
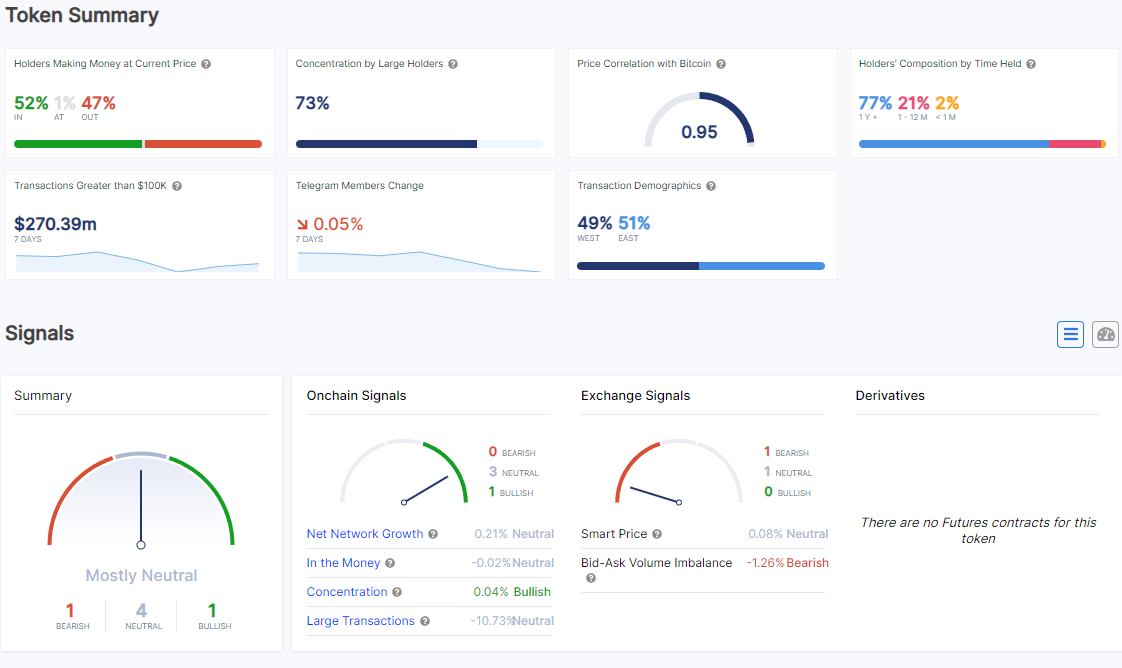
Based on the most recent data, 52% of SHIB holders are profitable at the current price, while 47% are not. This even distribution indicates that smaller investors remain confident in spite of the whale movement.

However, large holders still hold a sizable portion of the supply, as their 73% concentration suggests. Their decreased activity may result in fewer large-scale sell-offs. Transactions that exceed $100,000 are still showing a respectable volume in the last seven days, with 2.4 trillion transacted in the last 24 hours, suggesting that even though whales are not active, there is still a lot of movement going on.
On-chain signals exhibit a 0.04% increase in concentration, indicating a slight bullish trend, while other indicators stay neutral. A bearish bid-ask volume imbalance of -15% is reflected in exchange signals, suggesting that there may be selling pressure. On the other hand, the neutral smart price signal by IntoTheBlock indicates that the current price may be reasonable and steady.
SHIB is trading near $0. 00001716 on the technical chart below its 50 EMA at $0.00002217 and significantly below 200 and 100 EMAs. The RSI at 33 shows that SHIB is getting close to the oversold area, which could attract some more buyers looking for cheaper entry.
