Mantra (OM) stands out as one of the few tokens in the green amidst the widespread downturn in the crypto market. However, its potential to maintain this upward trajectory appears limited. This article delves into the factors behind Mantra’s recent surge and assesses its future movement.
Partnership with MAG
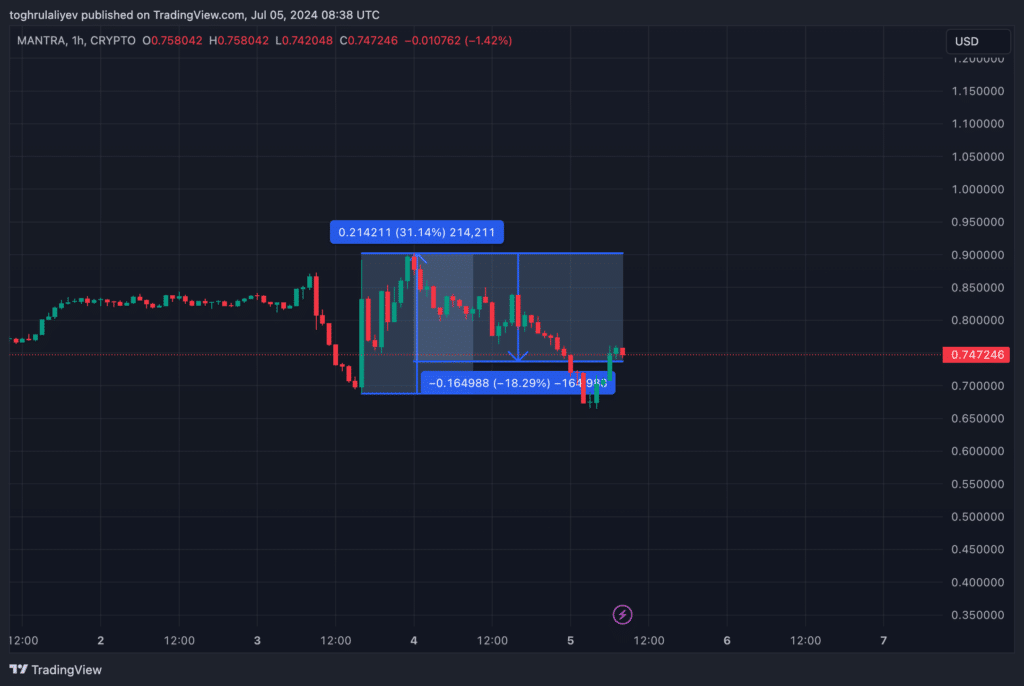
The primary reason for Mantra’s recent performance is the significant announcement made on July 3, where UAE real estate giant MAG partnered with Mantra to tokenize $500 million in real estate assets. This announcement brought a wave of positive sentiment towards Mantra, propelling its price by 31% in just eight hours. Despite this spike, such sudden increases are usually unsustainable, as seen with Mantra already dropping more than 18% in a bit over a day.

Market outlook and Bitcoin’s influence
To understand Mantra’s potential movement in the coming days or weeks, it is crucial to consider Bitcoin’s price trajectory. Our recent analysis suggests Bitcoin might drop to the $50,000-$52,000 range. At the time of writing that article, Bitcoin was hovering around $57,000, and it is now around $53,500.
If Bitcoin’s price indeed drops to the predicted range, representing another 3-7% downturn, it is likely the entire crypto market will follow. Historical data shows that market movements often align with Bitcoin. Therefore, investors should avoid long positions on Mantra to prevent the risk of buying into a declining market.
Technical analysis: Fibonacci retracements and support levels
Analyzing Mantra using Fibonacci retracements provides insight into its potential future movements.
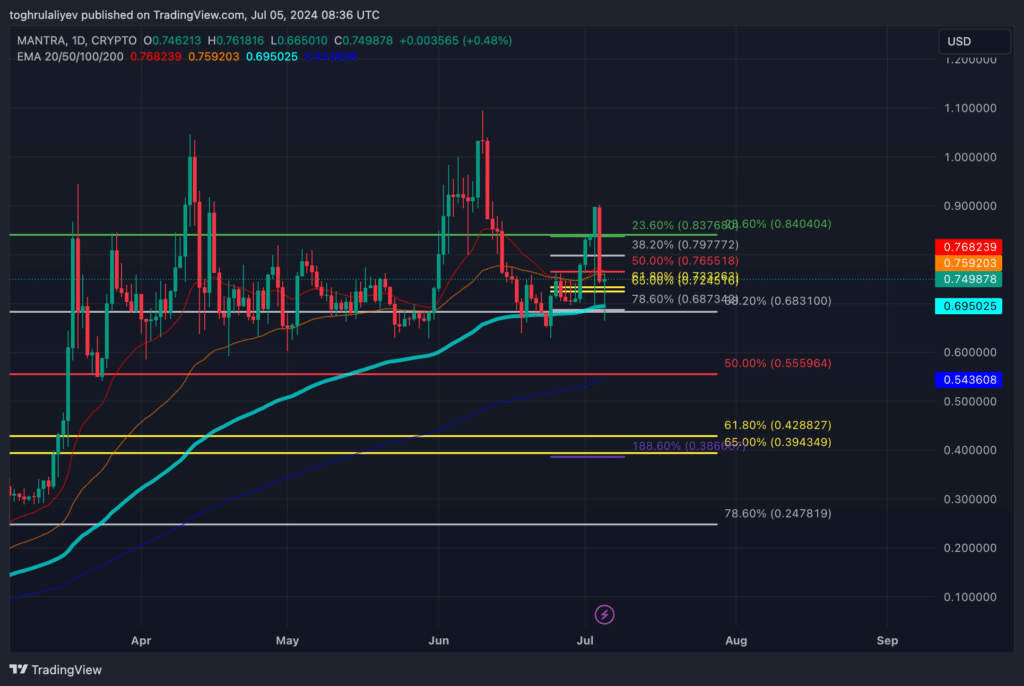
- Short-term analysis: Mantra’s recent price used the 78.6% Fibonacci retracement from the June 24 to July 5 range as support. This level aligns with the macro 38.2% Fibonacci retracement from the low in December 2023 to the peak in June 2024 and the 100-day moving average on the daily timeframe. If Bitcoin holds its current levels, Mantra may consolidate around $0.75

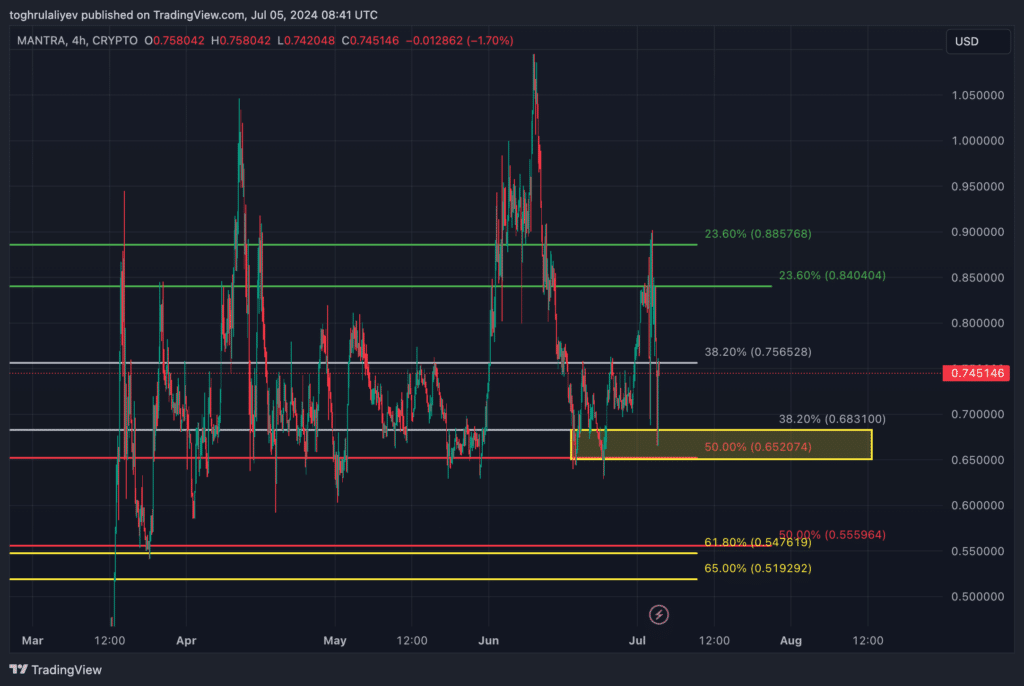
- Downside risk: If the market declines further, positive news about Mantra will likely not be enough to sustain its price. Mantra may drop to its historical support levels, aligning with macro Fibonacci retracements from December and February lows to the June peak, potentially falling to the $0.652-$0.683 range.

Strategic considerations
When assessing tokens that deviate from typical market movements, it is essential to evaluate the broader market context. Investors should consider the following:
- News Impact: Determine if the news driving the token’s price is significant enough to counteract broader market trends.
- Market Absorption: Assess whether positive news can absorb market downturns or if the token will follow the overall market decline.
The strategy involves shorting Mantra from its current price point to the $0.652-$0.683 range. This trade is among the riskiest, relying on the prediction that Bitcoin will drop further. Bitcoin has already fallen significantly from $63,000 to $53,500, and while our prediction stands at $50,000-$52,000, this remains a high-risk trade because there is a possibility that the bears have stepped away and bulls are in charge now. Another issue is that if Mantra announces something more in the coming days or weeks, the price will also go upward. Our case bets on two conditions: number one, Bitcoin goes down further, and number two, Mantra, has no more announcements.
In conclusion, shorting Mantra appears more rewarding, given the current market conditions and Bitcoin’s projected decline. However, investors should weigh the risks carefully.
Disclosure: This article does not represent investment advice. The content and materials featured on this page are for educational purposes only.
