Chainlink – What LINK’s latest breaches tell us about its reversal odds
07/06/2024 09:00
Chainlink is experiencing one of its most challenging periods in recent months, having breached several critical support levels in the...

- Traders have taken short positions against LINK
- At press time, LINK was trading in the negative for the third straight day
Chainlink is experiencing one of its most challenging periods in recent months, having breached several critical support levels in the last 24 hours. This downturn in price has significantly impacted market sentiment, leading to a shift where sellers are now dominating the market. Over the long term, this could mean a sustained period of bearish pressure and potentially more downward movement in LINK’s price.
Chainlink breaks support
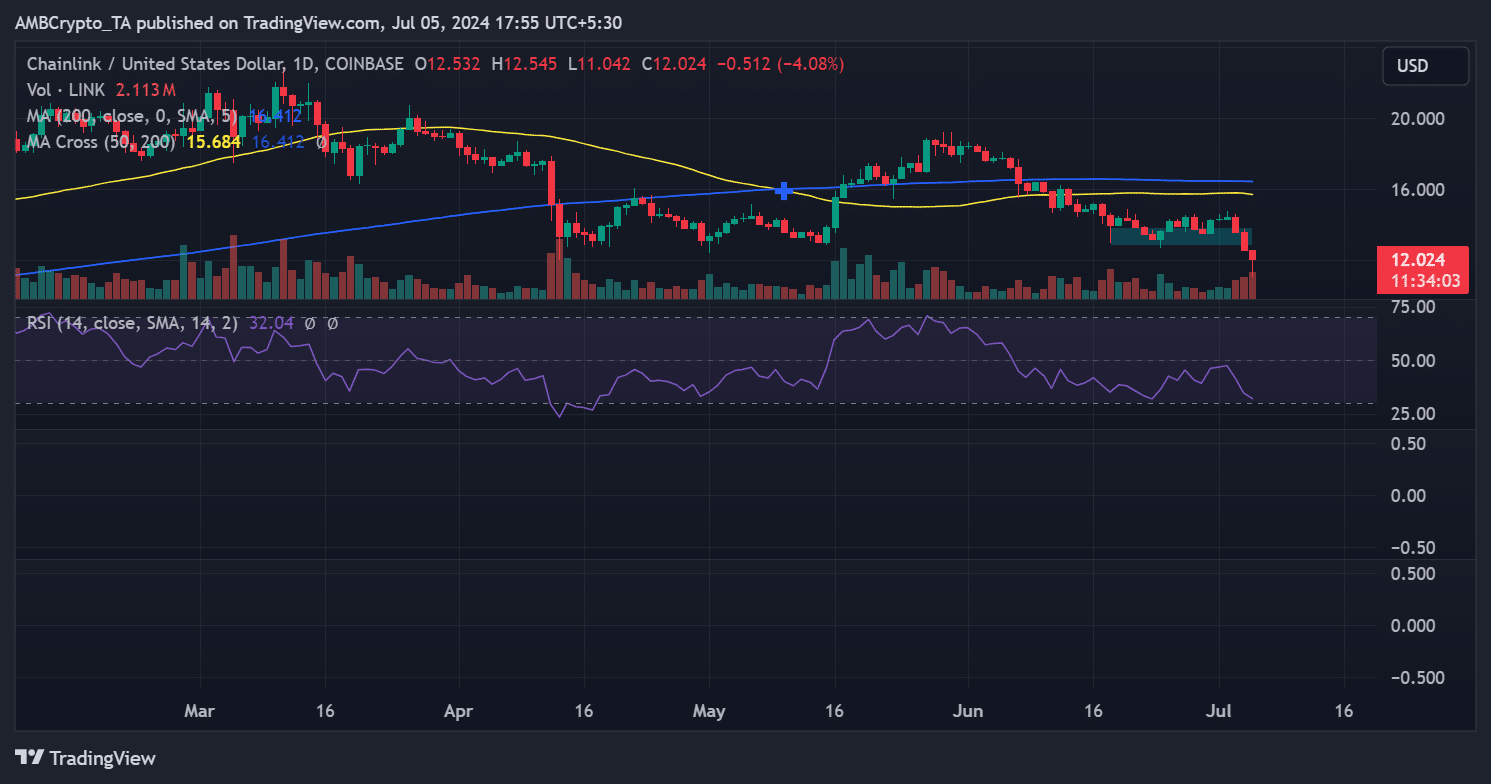
The price trend for Chainlink (LINK) has been southbound over the past three days. In fact, according to an analysis from AMBCrypto, the decline began on 3 June with a 5.70% drop, bringing the price to around $13.5.
The following day, the altcoin recorded a further 7.66% deline, lowering its price to approximately $12.5. At press time, it was trading at around $12 after an additional decline of over 4%.
The analysis also highlighted a significant shift in Chainlink’s technical indicators. The long and short moving averages, represented by yellow and blue lines, respectively, flipped from support to resistance levels.
These resistance levels are now at the price levels of $15.6 and $16.2.
Additionally, the altcoin’s former support levels at around $13.8 and $12.8 turned to become resistance levels, due to the crypto’s recent depreciation.
These findings pointed to a recent hike in selling pressure across LINK’s market, something that might stop the altcoin from noting a trend reversal.
Sellers take charge of LINK’s market
An analysis of the weighted funding rate on Coinglass revealed a notable shift over the last 24 hours. As trading closed on 4 July, the funding rate significantly dropped to about 0.0016%.
This suggested that while there was a decline, buyers’ interest remained as the rate stayed above zero – A sign of slight bullish sentiment.
However, another set of data had more interesting observations – The funding rate plummeted to -0.0143. This sharp decline can be interpreted as a sign of a shift in market dynamics, with sellers now outnumbering buyers. The negative funding rate also means that more traders are taking short positions and are betting on LINK falling further.
Where will Chainlink go from here?
The weighted funding rate for Chainlink pointed to the significant presence of short positions, underscoring a strong bearish sentiment in the market. For the market to reverse, buyers would need significant effort to overcome the prevailing mood.
Additionally, Chainlink’s Relative Strength Index (RSI) seemed to be approaching the 30-threshold. If the RSI crosses below 30, it will officially enter the oversold zone.
– Is your portfolio green? Check out the Chainlink Profit Calculator
Historically, a dip into this zone can catalyze a market reversal, as potential buyers might view the asset as undervalued and start accumulating, potentially driving prices up. Hence, ongoing market conditions might set the stage for a possible turnaround if buyers respond to perceived low prices.

