Shiba Inu update: Key indicators forecast up to 45% price drop – What now?
07/07/2024 20:00
Shiba Inu maintained a bearish price structure and its indicators outlined a strong downtrend in progress as investors see their gains eroded.

- Shiba Inu has a strongly bearish outlook from the price action and technical indicators.
- The Fibonacci levels showed that SHIB prices could fall toward the late February lows.
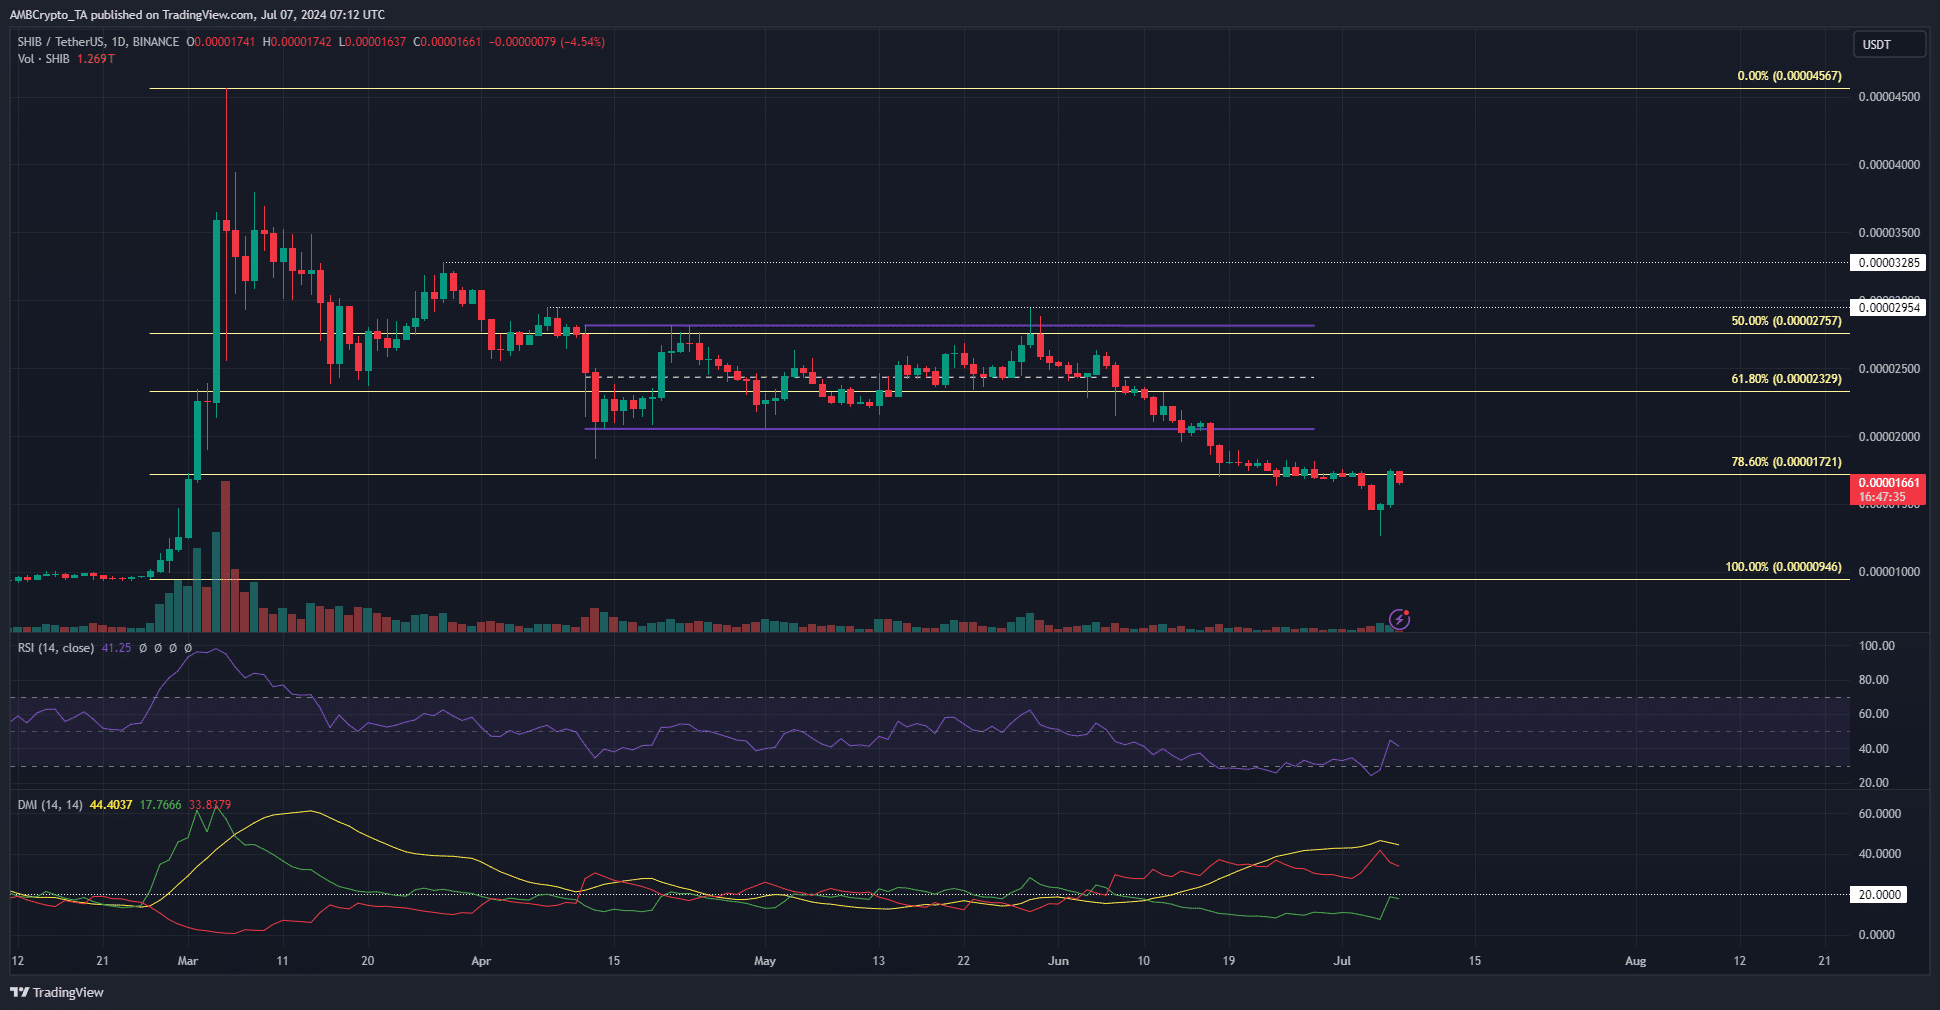
Shiba Inu [SHIB] posted a 38% price bounce from the lows over the past two days but could not scale the former support level at $0.0000178, which now acted as resistance. This could see the prices dive deeper.
A recent AMBCrypto report noted that SHIB was undervalued in the short-term, but also that the network growth has declined. The price bounce followed this- but can the bulls continue to drive prices higher?
Will Shiba Inu prices recede by another 30%-45% next?
The price action on the 1-day chart was firmly bearish. After the range breakdown SHIB continued to form a series of lower highs and lower lows. The RSI remained below neutral 50 to reinforce the idea of a downtrend.
The DMI showed the -DI and the ADX were above 20 since the 14th of June, marking an intense downtrend in progress. This has not changed either.
The 78.6% Fibonacci retracement level was broken and flipped to support. Therefore, a move downward to the 100% level or even further south is likely to develop for the meme coin.
On-chain metrics show SHIB bulls were powerless
The mean coin age began to trend downward in the final week of May. This showed distribution and the metric has not yet embarked on an uptrend. It signaled steady selling and little accumulation across the network.
Read Shiba Inu’s [SHIB] Price Prediction 2024-25
The dormant circulation saw a spike on the 6th of July as prices bounced, which could be an early warning of additional selling pressure. The daily active addresses remained steady compared to the past month.
Disclaimer: The information presented does not constitute financial, investment, trading, or other types of advice and is solely the writer’s opinion.
