Can AVAX jump to $30 in July? Rising trader demand says yes!
07/14/2024 13:00
Unlike many other altcoins, Avalanche [AVAX] has been trading sideways in the last seven days. But that could be in line to change

- Traders who purchased AVAX within the last 30 days have seen the highest increase among all holder categories.
- Technical analysis showed that the token could see its price jump to $30.05.
Unlike many other altcoins, Avalanche [AVAX] has been trading sideways in the last seven days. But that could be in line to change, according to AMBCrypto’s analysis.
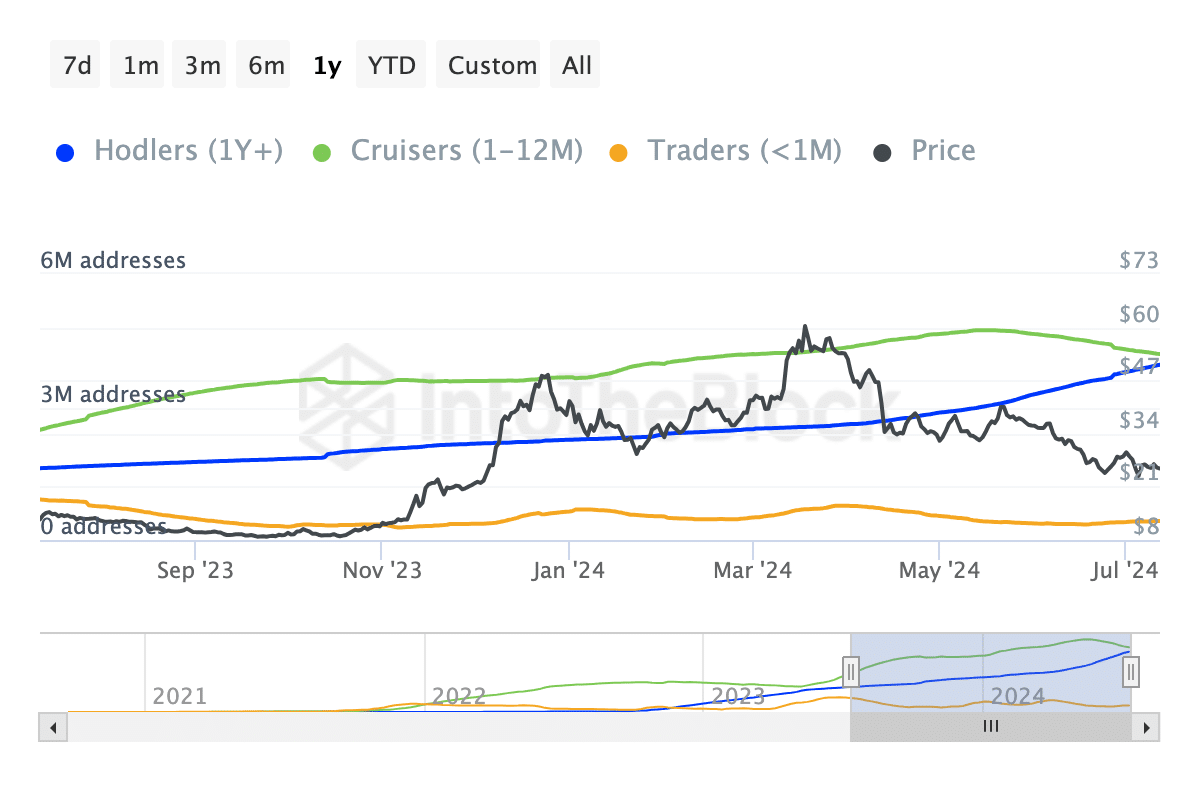
One reason for this forecast is the observation we saw from the Addresses by Time Held. This metric shows if short-, mid, or long-term holders are buying more of a token. or doing otherwise.
It’s traders’ demand over holders faith
To achieve this, the blockchain analytic platform groups them into three. The first is Holders who have possessed the token for more than a year. Second in the group is Cruisers.
Cruisers are passive investors who have held a token between one to 12 months. Last on the list are Traders who purchased with the last 30 days.
At press time, traders had the highest increase out of the three. This implies that short-term holders are bullish on the AVAX potential.
Should this number continue to increase, AVAX price could be set to trade higher. As of this writing, the price was $25.81. Can the price of the token reach $30?
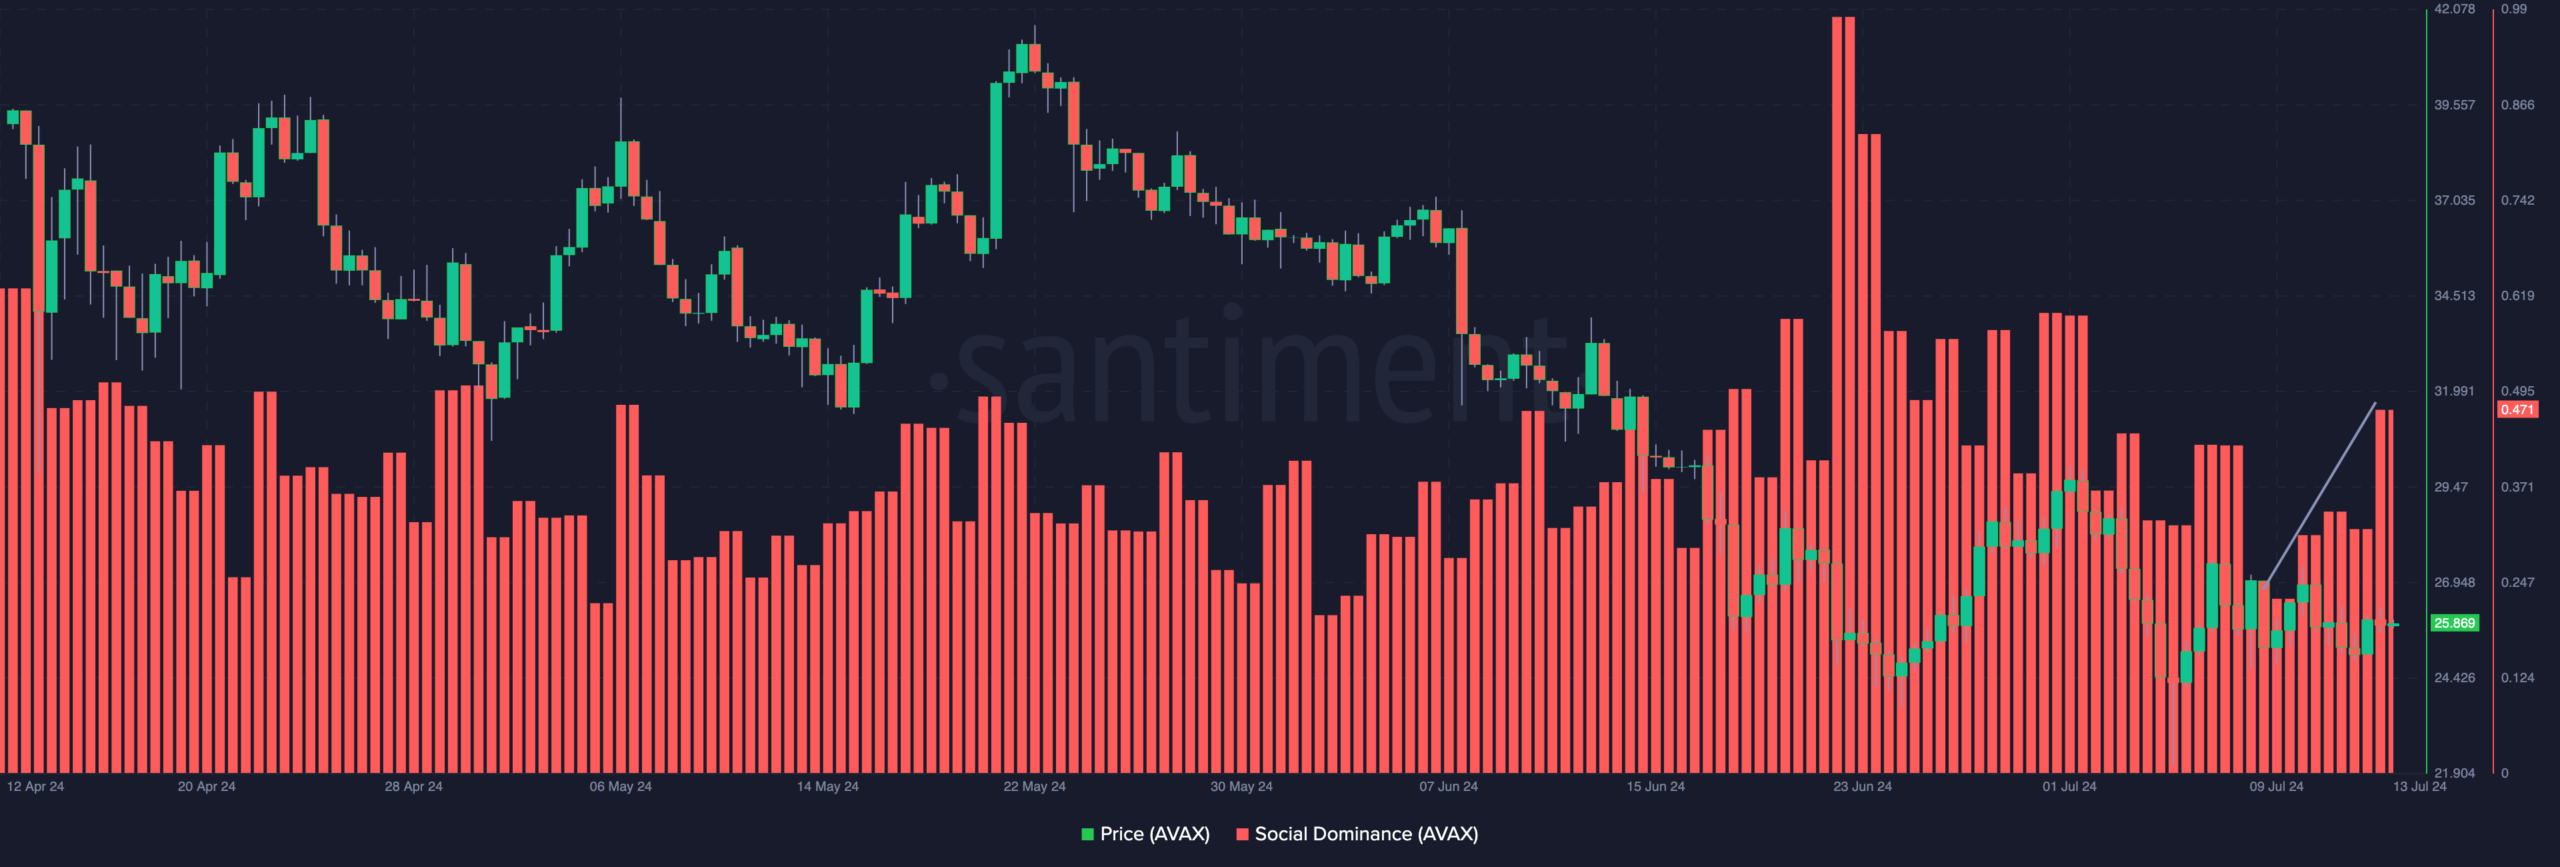
One of the ways we can predict this is by looking at the demand for the token. A metric that could give insights into this is the social dominance.
Social dominance measures the rate of discussions about a token compared to other cryptocurrencies in the top 100. If social dominance falls, it means that search and conversation related to the token is falling.
However, an increase in the metric suggests otherwise. At press time, Santiment data showed that the dominance had increased to 0.471. This means that there was a surge in the AVAX-related discussions.
Breakout on the cards?
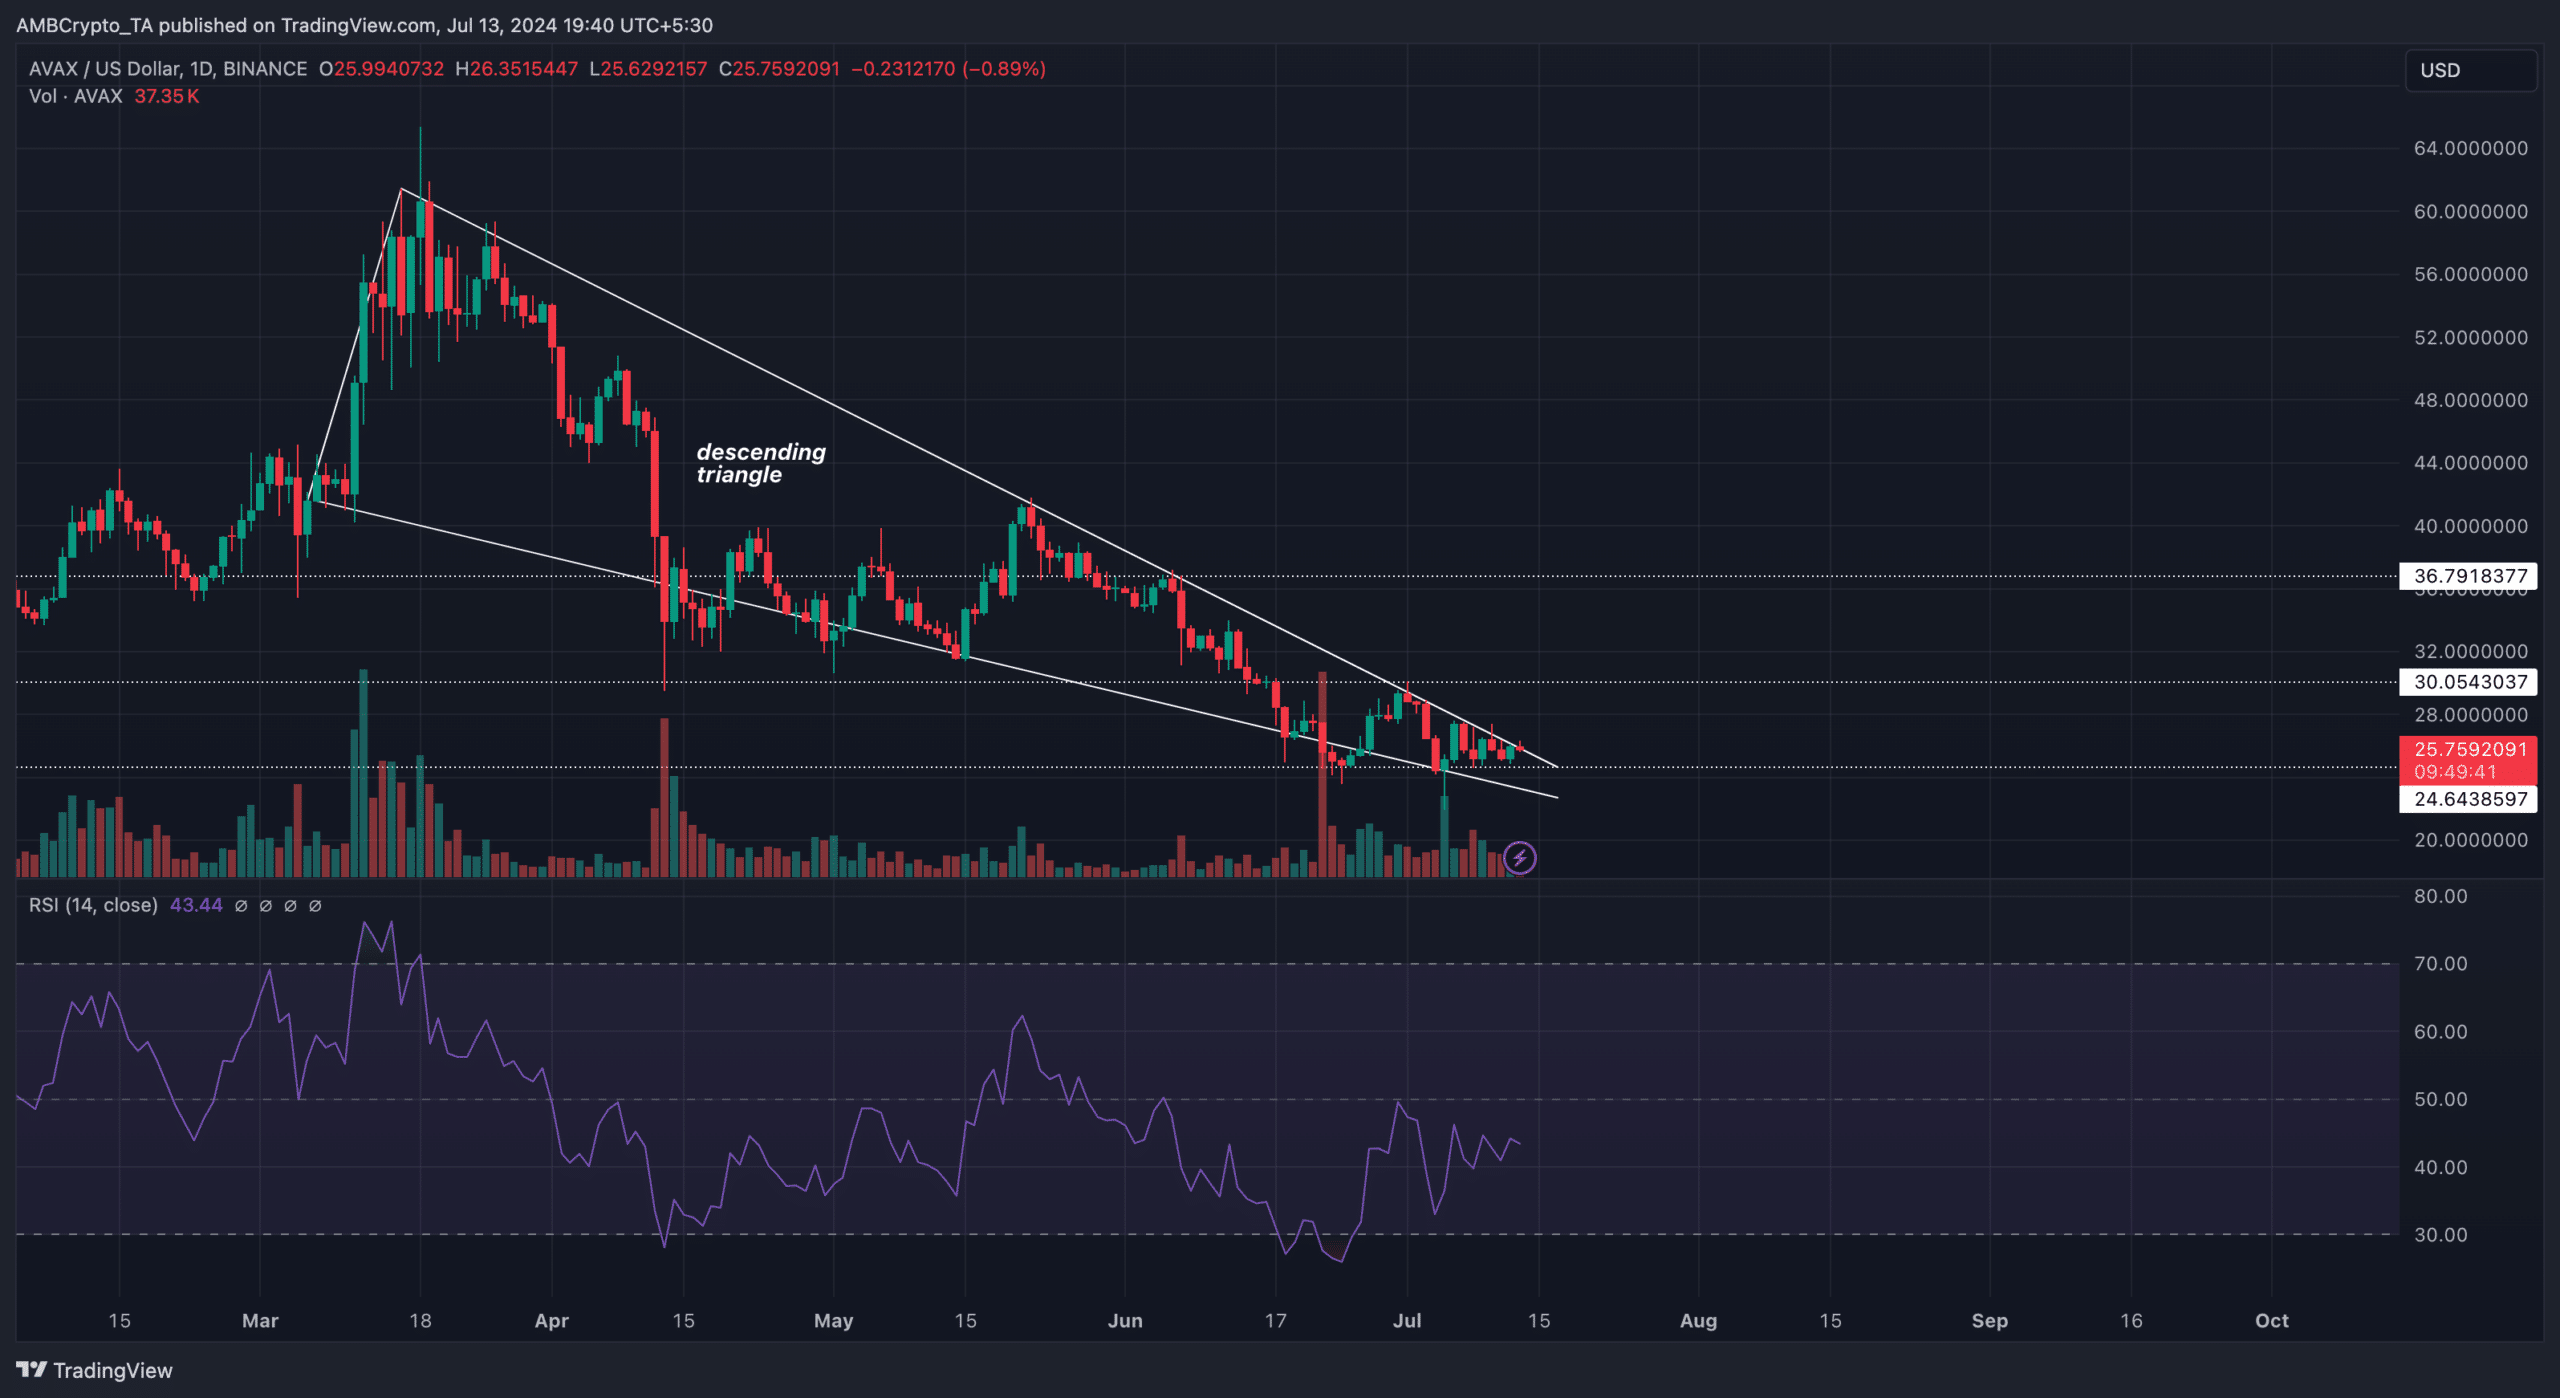
From a technical perspective, the AVAX/USD daily chart showed the formation of a descending triangle. The descending triangle chart pattern appears when the price of a token hit lower highs and lower lows, and it is a bearish pattern.
However, this pattern helps to identify seller exhaustion. According to the chart below, this was the case with AVAX, with the pattern hinting at a breakout.
In addition, the Relative Strength Index (RSI) revealed that the token had exited the oversold region it was on 4th July. RSI measures momentum.
Readings below 30.00 indicate oversold levels while reading at 70.00 or above indicate overbought levels. Therefore, the rising reading implies increasing momentum for the altcoin.
Is your portfolio green? Check the AVAX Profit Calculator
If this continues, AVAX’s short-term target could start from $30.05. That would only be the case if bulls defend the support at $24.64.
Should the market condition gets intensely bullish, the price might jump to $36.79. However, this forecast might not happen if selling pressure appears again.
