Shiba Inu (SHIB) to Reveal Rare Pattern First Time in 2024: Details
07/14/2024 18:30
Coming days remain crucial for Shiba Inu with price on brink of rare pattern formation

Disclaimer: The opinions expressed by our writers are their own and do not represent the views of U.Today. The financial and market information provided on U.Today is intended for informational purposes only. U.Today is not liable for any financial losses incurred while trading cryptocurrencies. Conduct your own research by contacting financial experts before making any investment decisions. We believe that all content is accurate as of the date of publication, but certain offers mentioned may no longer be available.
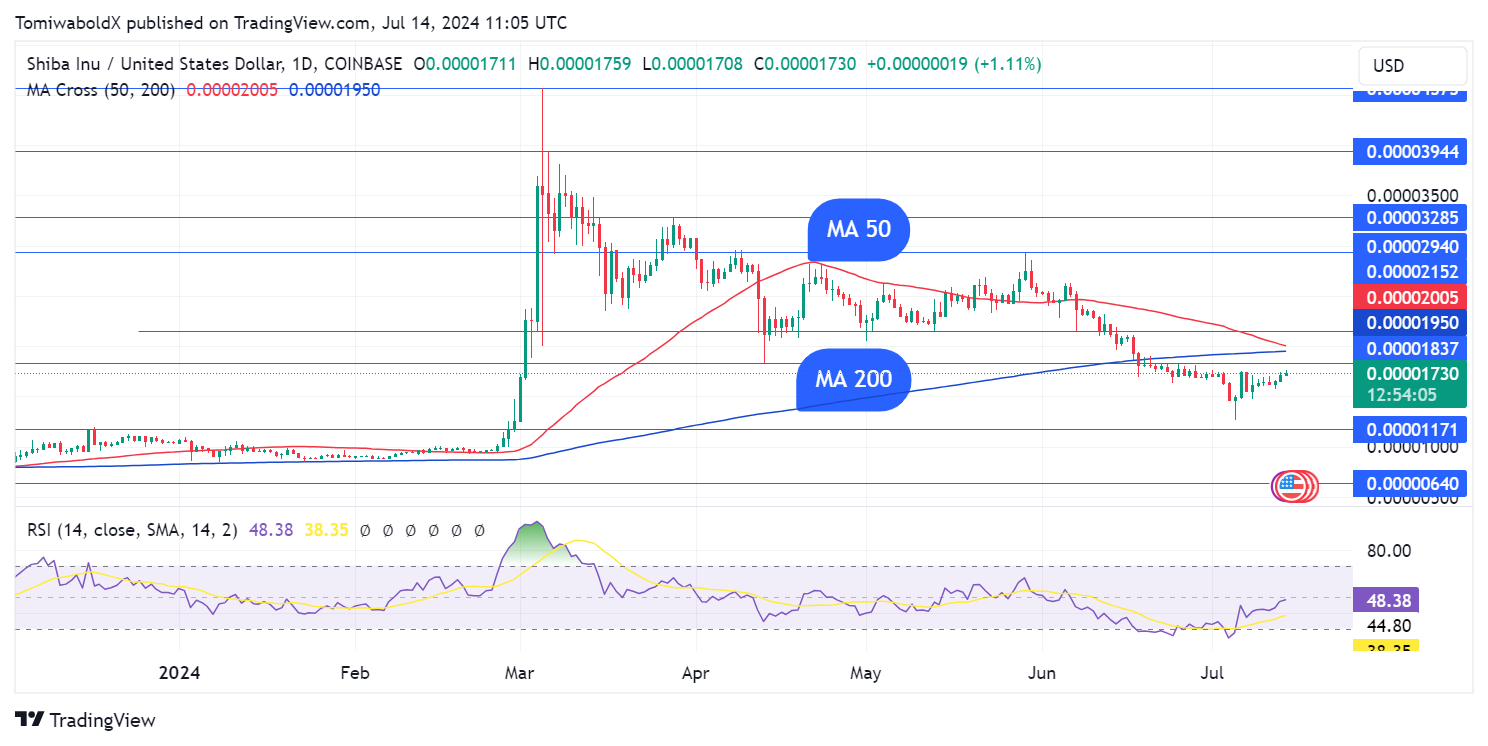
Dog-themed cryptocurrency Shiba Inu (SHIB) is on the brink of revealing a moving average crossover for the first time in the year 2024. With the daily SMAs 50 and 200 poised to converge, the market is keeping a watchful eye out for the formation of either a golden or death cross.
According to TradingView data, SHIB will see its first moving average crossover this year, with the daily simple moving averages (SMA) of 50 and 200 projected to converge within a few days. The last time SHIB experienced a golden cross was in December 2023.

Traders typically use the 50-day and 200-day SMAs to gauge market trends, with crossovers resulting in either a golden cross or a death cross. Golden cross, a bullish pattern, occurs when the 50-day SMA crosses above the 200-day SMA, signaling a potential upswing.
The death cross, on the other hand, is a bearish pattern that occurs when the 50-day SMA crosses below the 200-day SMA, suggesting a possible downtrend.
Golden cross or death cross?
As SHIB approaches this critical juncture, market watchers are keenly observing the behavior of the 50-day and 200-day SMAs. Currently, the 50-day SMA appears to be heading downward, raising the likelihood of a death cross. If this pattern occurs, it could indicate a bearish trend, potentially impacting SHIB’s price.
As the scenario unfolds, the daily SMA 50 and SMA 200 will be closely watched for their convergence and subsequent crossover. The nature of the crossover — whether it will be a golden cross or a death cross — remains uncertain.
As SHIB nears this pattern formation, all eyes are on its price to adjudge the next direction. A death cross formation could usher in the bottoming phase for SHIB. A golden cross might herald a fresh bullish upswing for the SHIB price.
At the time of writing, SHIB was up 2.35% in the last 24 hours to $0.00001744 and up 6.35% weekly.
