Is XRP Ready for $0.7? Shiba Inu (SHIB) on Verge of $0.00002, Ethereum (ETH) Reversal Halted
07/17/2024 07:30
Market recovery continues, with numerous assets hitting important thresholds

Disclaimer: The opinions expressed by our writers are their own and do not represent the views of U.Today. The financial and market information provided on U.Today is intended for informational purposes only. U.Today is not liable for any financial losses incurred while trading cryptocurrencies. Conduct your own research by contacting financial experts before making any investment decisions. We believe that all content is accurate as of the date of publication, but certain offers mentioned may no longer be available.
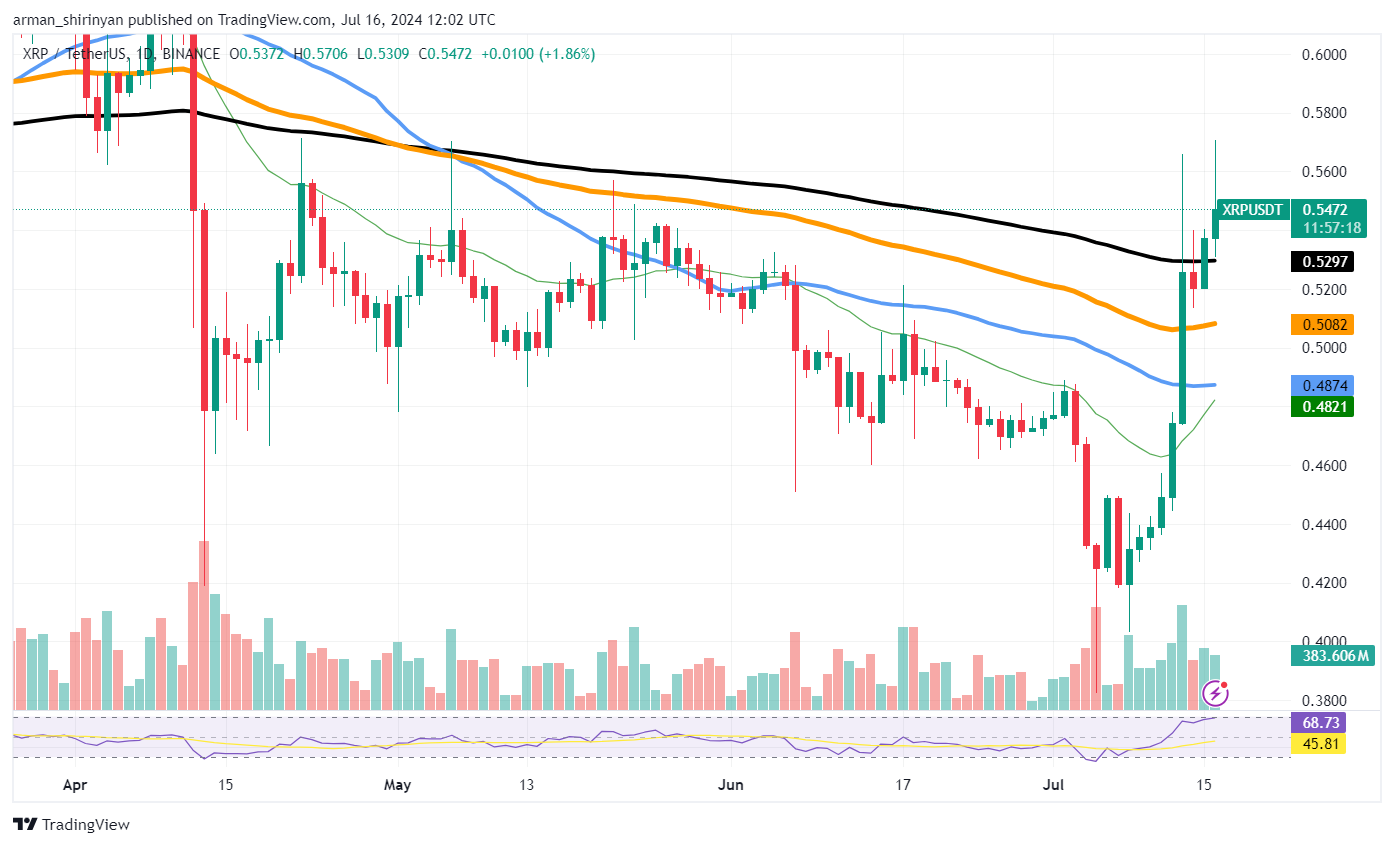
XRP's 30% rally placed the asset at the forefront of the bull market, with the potential to break even higher, potentially hitting this year's high of $0.7, but numerous factors should align for it.
Over the last few days, XRP has demonstrated remarkable strength, breaking through major resistance levels and drawing interest from the cryptocurrency community. With many speculating as to whether the momentum can push XRP even closer to $0.7, the rally has brought the cryptocurrency very close to a critical threshold.

Numerous signs point to the possibility that XRP will keep rising. First, there has been a noticeable surge in trading volume for the asset, which suggests that investors are actively participating in it. As more market participants join the rally, this spike in volume frequently precedes subsequent price increases.
Furthermore, technical research reveals that XRP has overcome a number of resistance levels and converted them into support. The previous thresholds at the $0.52 and $0.54 levels are now serving as support, giving the next leg up a strong foundation. Major cryptocurrencies like Ethereum and Bitcoin are also seeing gains, and the market's attitude toward cryptocurrencies is currently positive overall. This general bullishness on the market makes it easier for XRP to profit from the upward momentum.
Shiba Inu regains important positions
Shiba Inu is getting closer to the $0.00002 price threshold, which could be the next move for the asset since it is already trading close to the month's high. The main issue with the asset right now, though, is the lack of momentum.
With steady ascents toward the $0.00002 mark, SHIB has demonstrated a comeback in the last few days. This level poses a major psychological obstacle for investors and traders. Crossing above this barrier might open the door for more gains and possibly spark a bigger rally. Technical indicators show that SHIB has overcome a resistance level of 100 EMA.
The asset is currently up against the 200 EMA resistance, though, and it could be a major obstacle. Additionally, the Relative Strength Index (RSI) is getting closer to the overbought area, indicating that the current rally may be flagging. Even with the improvement, the trading volume is still low when compared to earlier spikes.
There is reason for concern because this weak trading activity suggests that there may not be enough market interest to sustain the current price movement. A spike in volume would be required to give SHIB the necessary momentum to continue on its upward trajectory.
Ethereum stops
Ethereum has hit the 50 EMA resistance level and now might retrace below key values like $3,300. Luckily, we saw a volume surge, which could be a sign of an upcoming reversal.
Ethereum experienced a setback after its recent rally brought it close to the 50 EMA resistance level. At $3,300, a critical support level, the asset is presently having difficulty holding its position. The 50 EMA presents a significant challenge because, if not decisively broken, it frequently functions as a barrier that can stop upward momentum. The increase in trading volume is one aspect of Ethereum's current market activity that is positive.
Stronger interest and participation from traders are frequently indicated by increased volume, and this can result in more persistent price movements. The increase may suggest that buyers are entering the market, which could lead to a reversal.
We might witness a further retracement of the asset, possibly testing lower support levels like $3,200, or even $3,000. This could happen if the asset is unable to hold its position above $3,300. Further, worth keeping an eye on is the Relative Strength Index, which can reveal if an asset is overbought or oversold and offer insights into potential future price movements.

