Why Ethereum, BNB are ready to bounce back with bull rallies
07/29/2024 08:00
The top altcoins like Ethereum [ETH] and BNB failed to perform over the last week as their charts remained red.

- Both ETH and BNB registered prices declined over the past week.
- Despite the bullish pattern, market indicators were bearish in ETH and BNB.
The top altcoins like Ethereum [ETH] and BNB failed to perform last week as their charts remained red. However, a recent analysis pointed out an update, which hinted at a trend reversal soon.
In fact, if that turns out to be true, then ETH and BNB might showcase a massive bull run.
Altcoins ready for a rally?
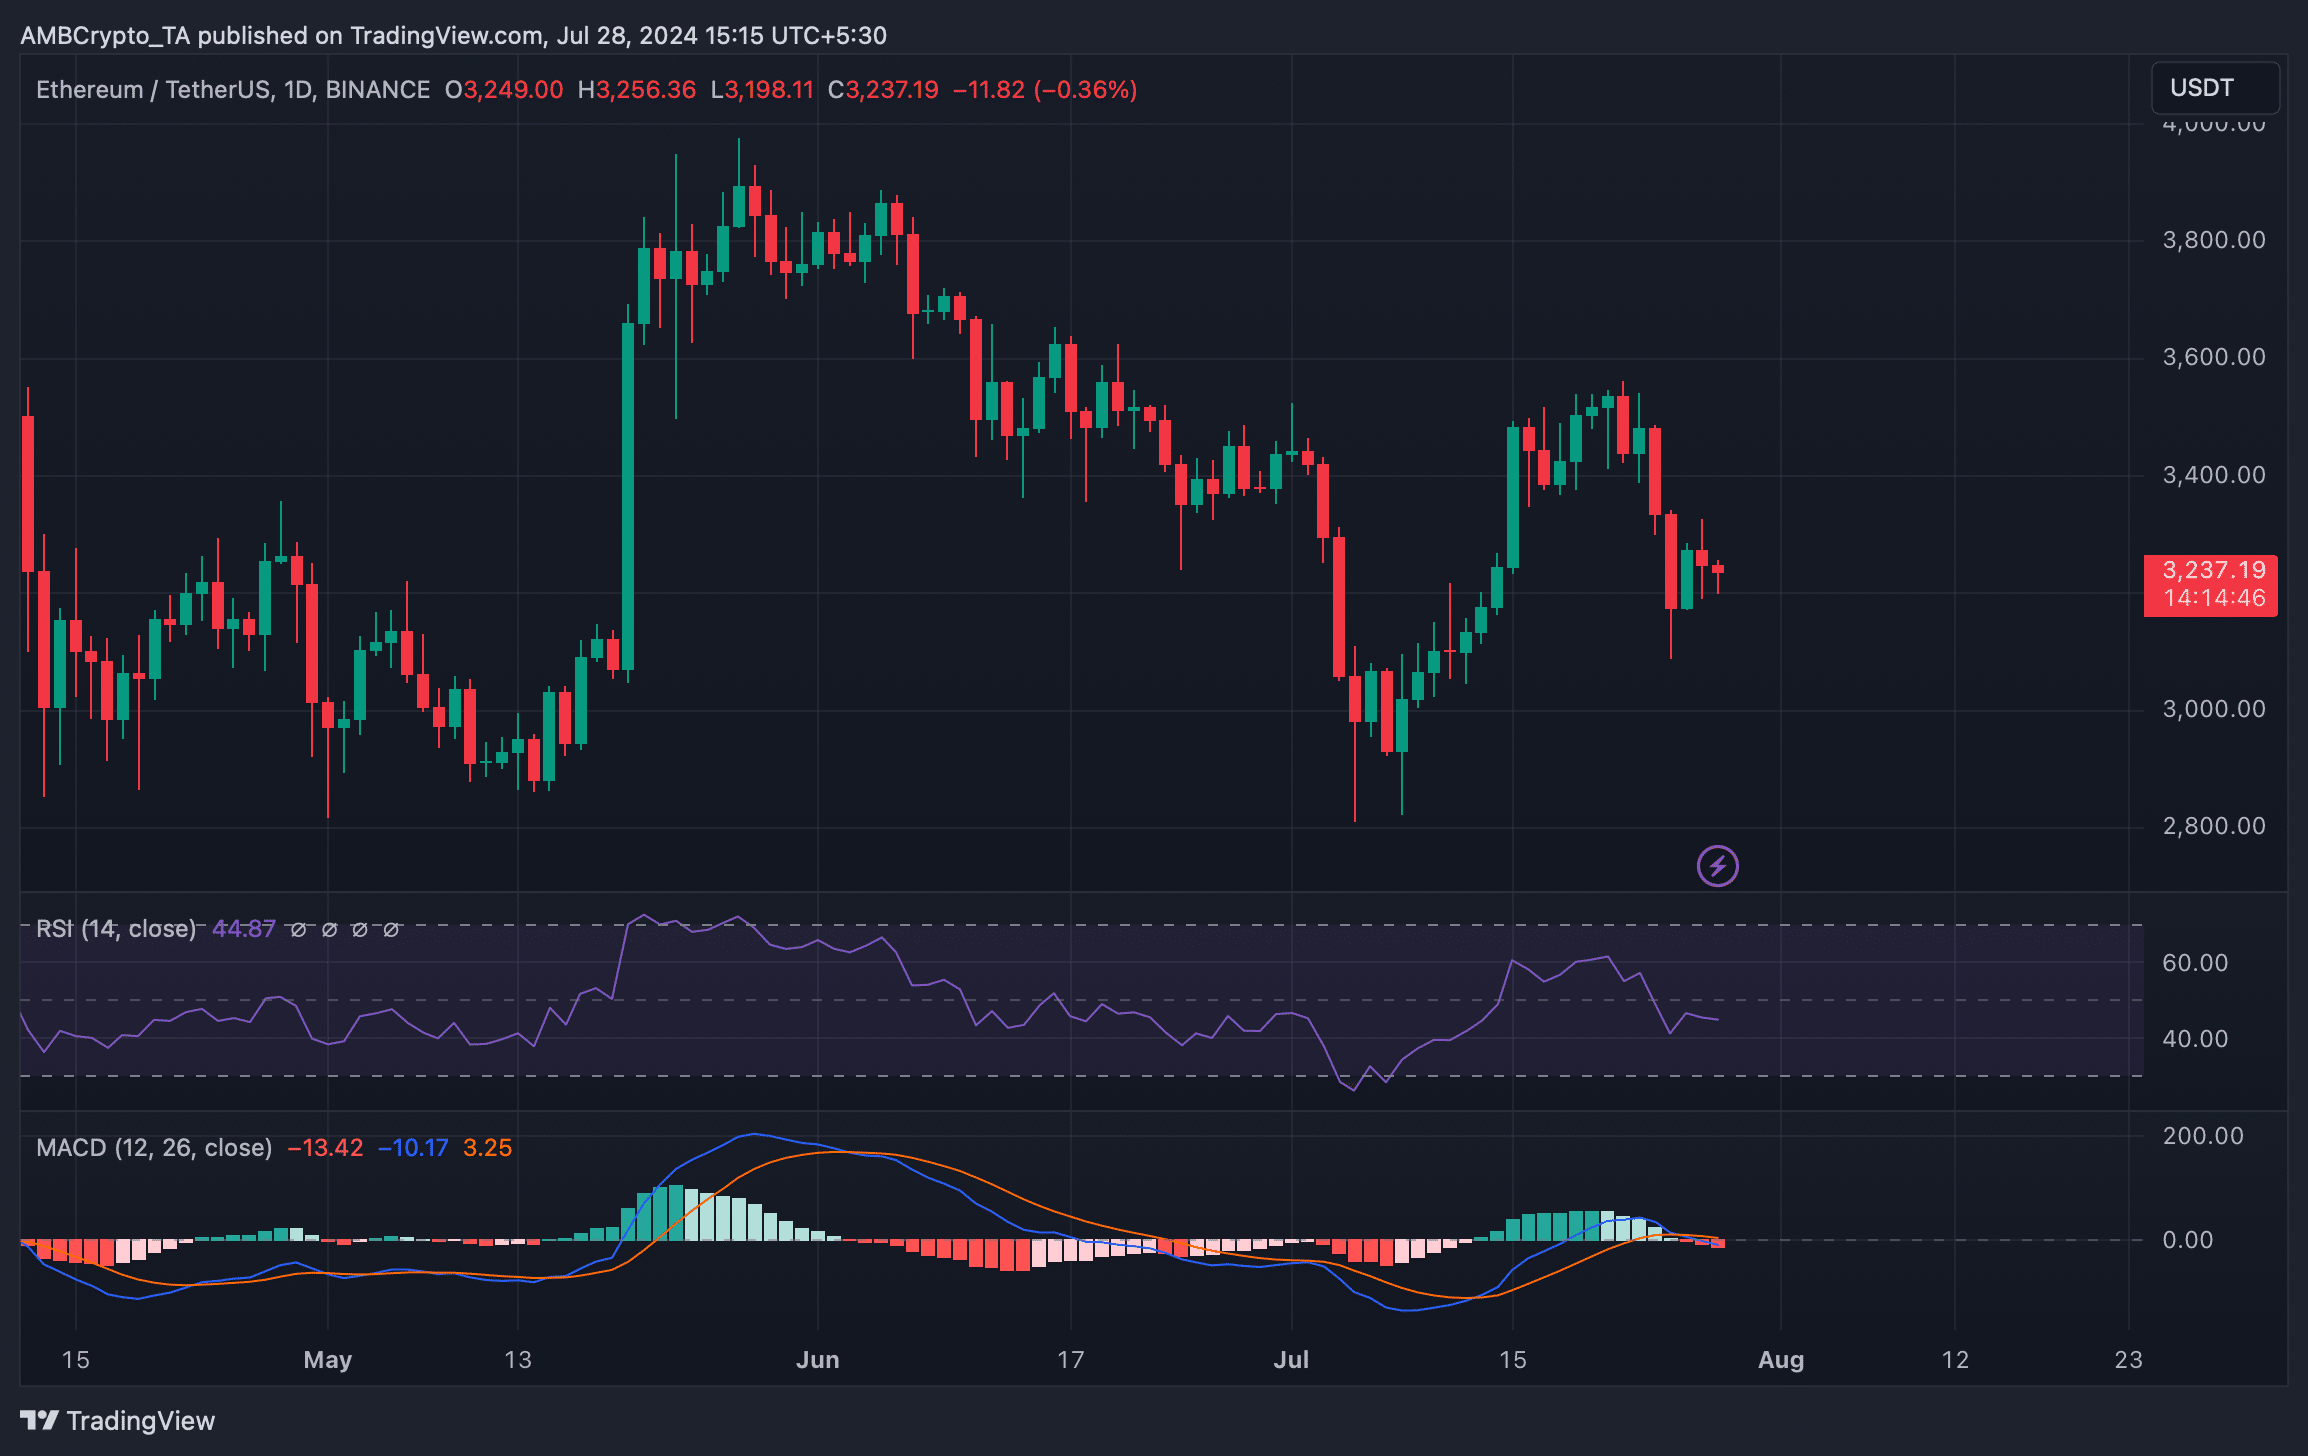
CoinMarketCap’s data revealed that ETH witnessed a 7% price correction last week. At press time, the king of altcoins was trading at $3,230 with a market capitalization of over $388 billion.
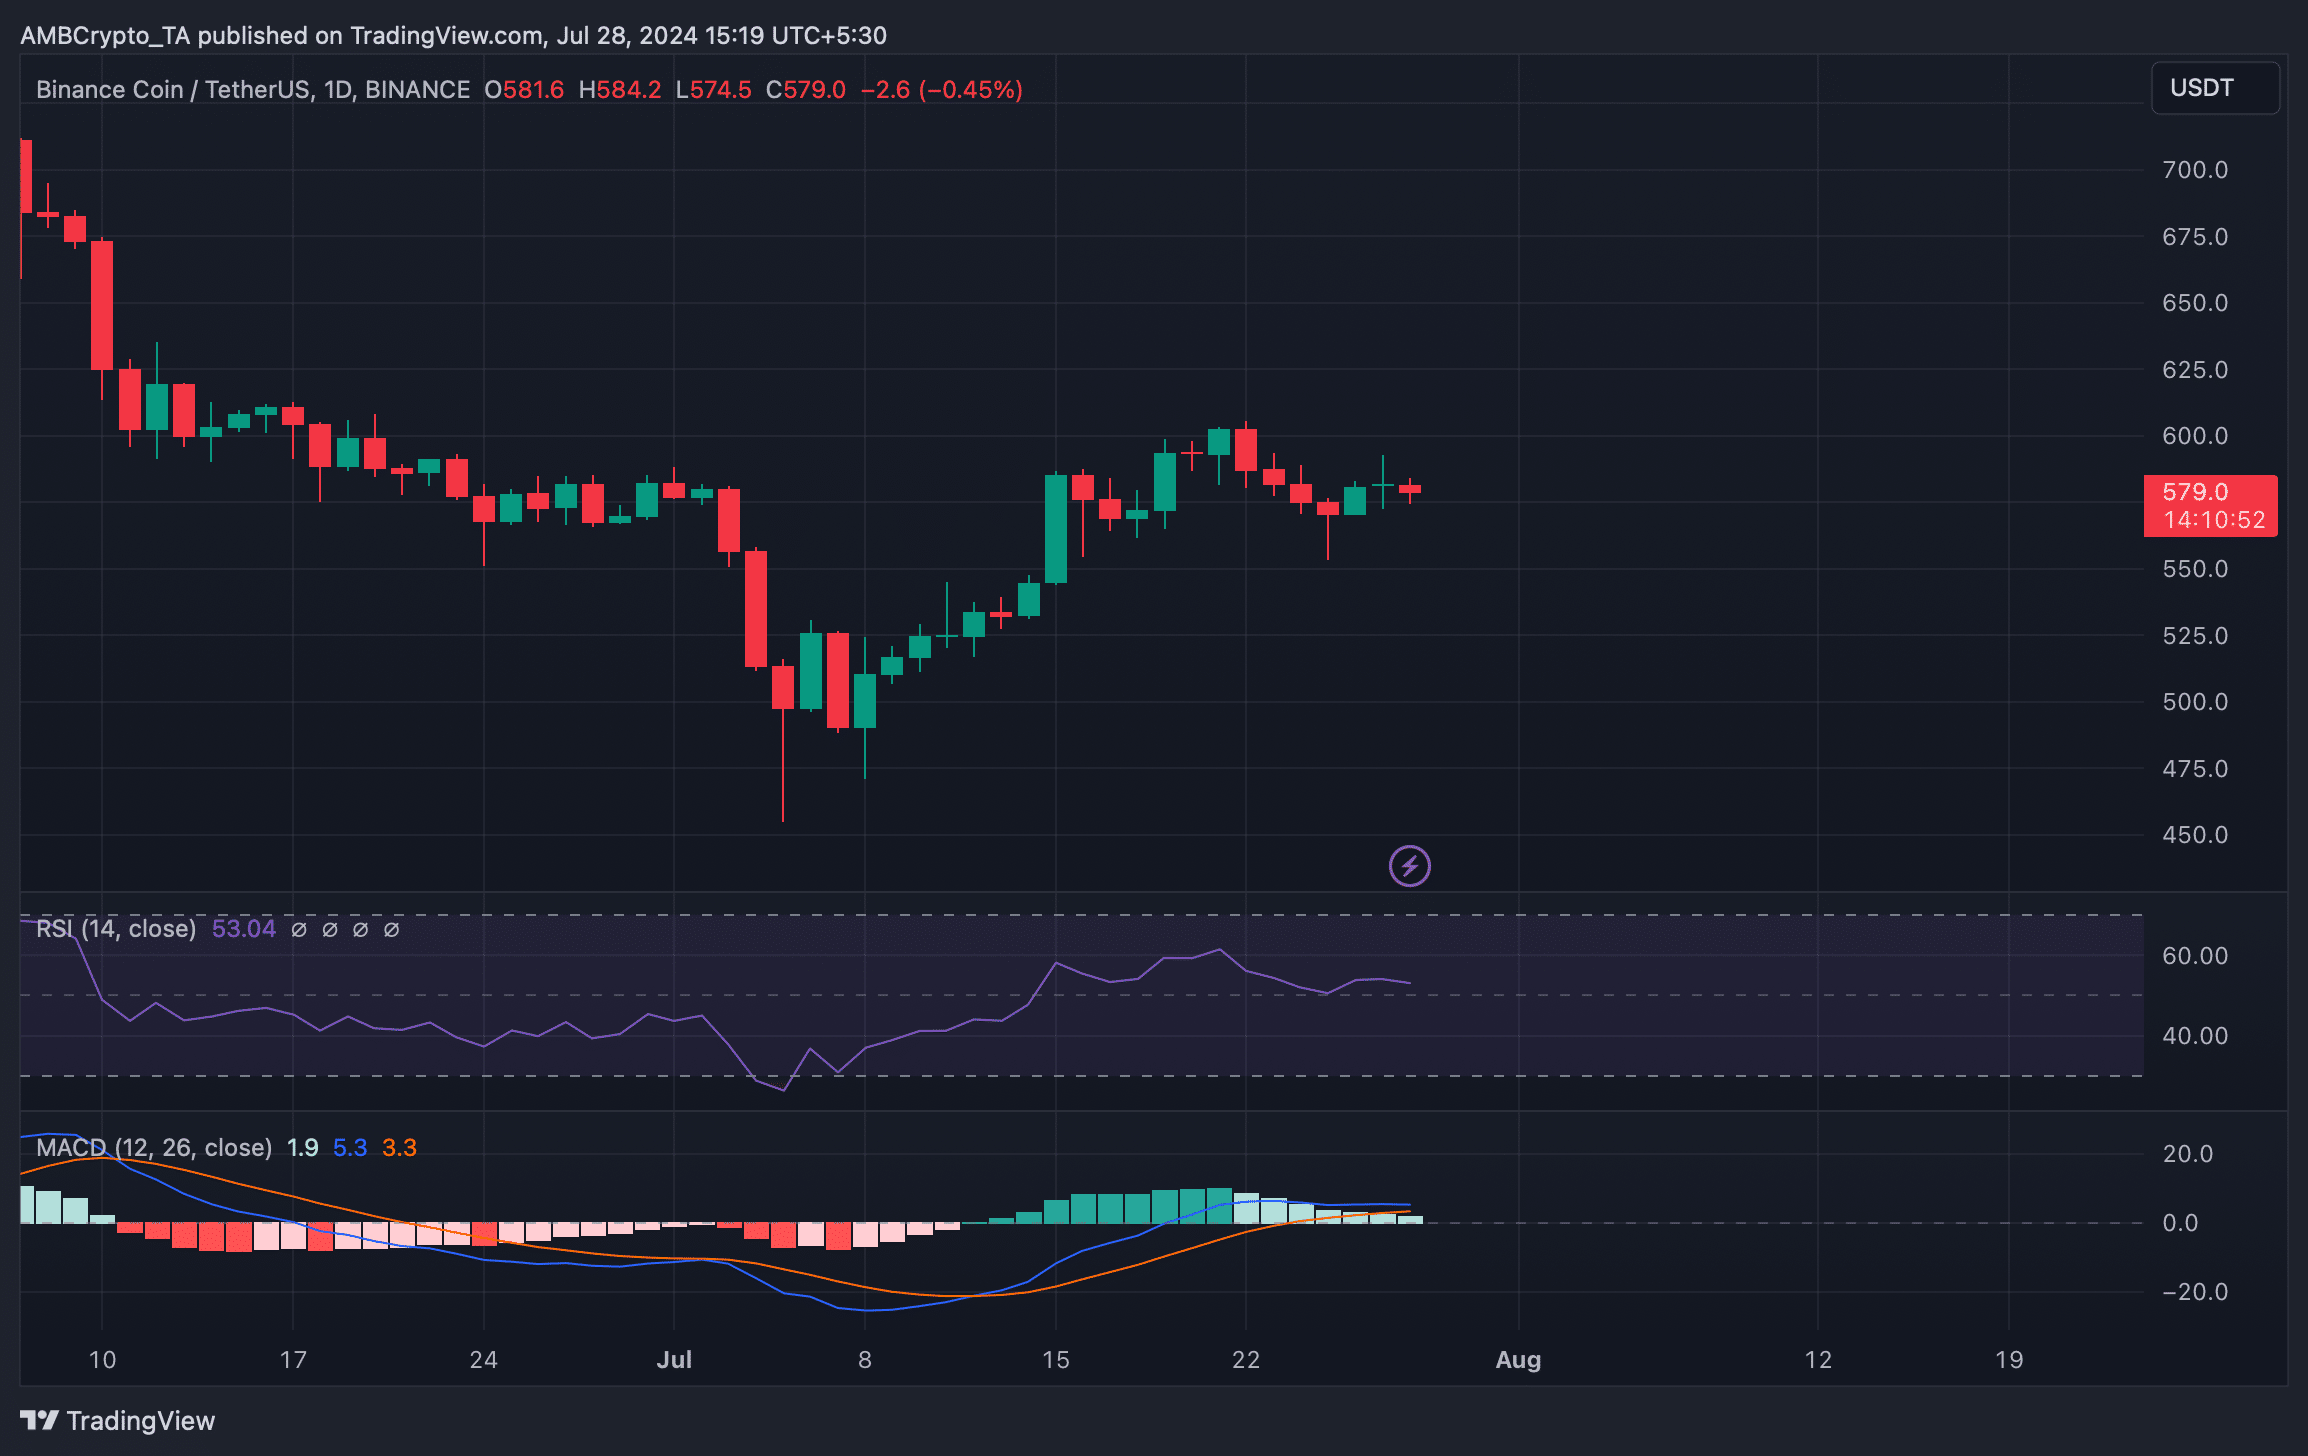
Similarly, BNB bears also took control of the market last week. The coin’s price dropped by more than 2% in the past seven days. At the time of writing, BNB was trading at $578 with a market cap of over $84 billion.
However, this entire trend of altcoins could change in the coming days.
Moustache, a popular crypto analyst, recently posted a tweet revealing a major development. As per the tweet, altcoins have formed a textbook cup & handle pattern over the last few years.
This suggested that the altcoins would soon begin a bull rally, which in turn meant that ETH and BNB would also witness price rises.
Therefore, AMBCrypto planned to have a closer look at these coins’ state to see whether they also hint at an upcoming rally.
ETH and BNB’s states
AMBCrypto’s analysis of CryptoQuant’s data revealed that BTC’s exchange reserve was increasing, which meant that selling pressure on the token was high. However, things in the derivatives market looked pretty optimistic.
The token’s funding rate was green, meaning that long position traders are dominant and are willing to pay short traders. Additionally, its taker buy/sell ratio indicated that buying sentiment was dominant in the futures market.
We then checked Ethereum’s daily chart. We found that the technical indicator MACD displayed a bearish crossover.
ETH’s Relative Strength Index (RSI) also registered a downtick, suggesting that investors might have to wait longer to see ETH turning bullish again.
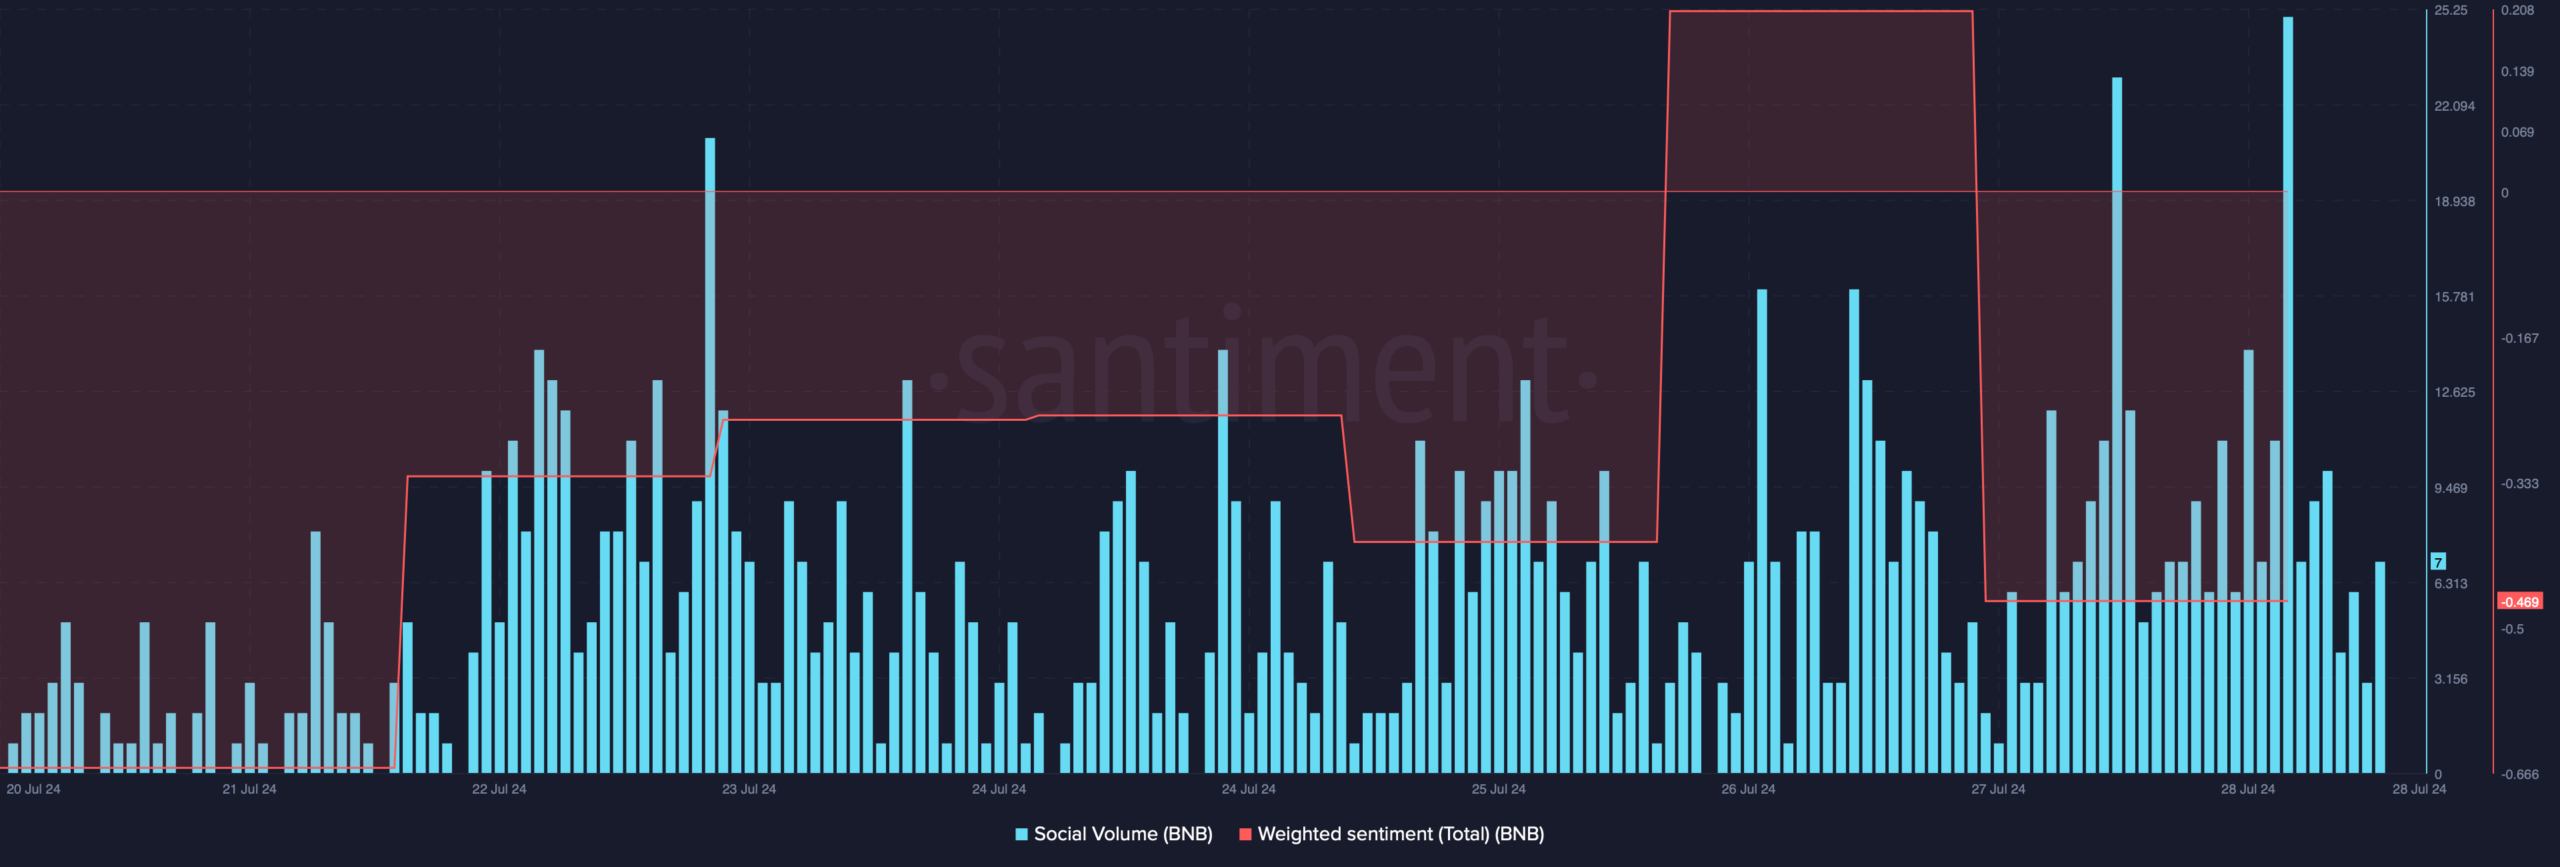
We then checked how BNB was doing. The coin’s social volume registered an uptick last week, reflecting its popularity.
However, the coin’s weighted sentiment remained in the negative zone. This clearly suggested that bearish sentiment around BNB was dominant in the market.
Read Ethereum’s [ETH] Price Prediction 2024-25
Like Ethereum, BNB’s technical indicators also looked bearish. For example the MACD displayed that there was a chance of a price correction.
Moreover, its Relative Strength Index (RSI) also took a slightly southward path.


