Dogwifhat (WIF) Looks to Sustain Rally After Short-Lived Peak
08/08/2024 18:30
Key technical indicators assessed on a four-hour chart suggest that popular meme coin Dogwifhat (WIF) is well positioned to extend its gains.
The spike in the values of Solana-based meme coins on Wednesday led Dogwifhat (WIF) to record a double-digit rally during the day’s trading session.
The price of the dog-themed meme asset climbed by 66% to an intraday high of $1.77, outperforming the leading asset, Bitcoin (BTC), and other memecoins.
Dogwifhat Seeks to Remain “on Top”
At press time, WIF trades at $1.70. Its value has since declined 3% from the $1.77 high recorded on Wednesday. Despite the minor price fall, WIF is poised to extend its rally.
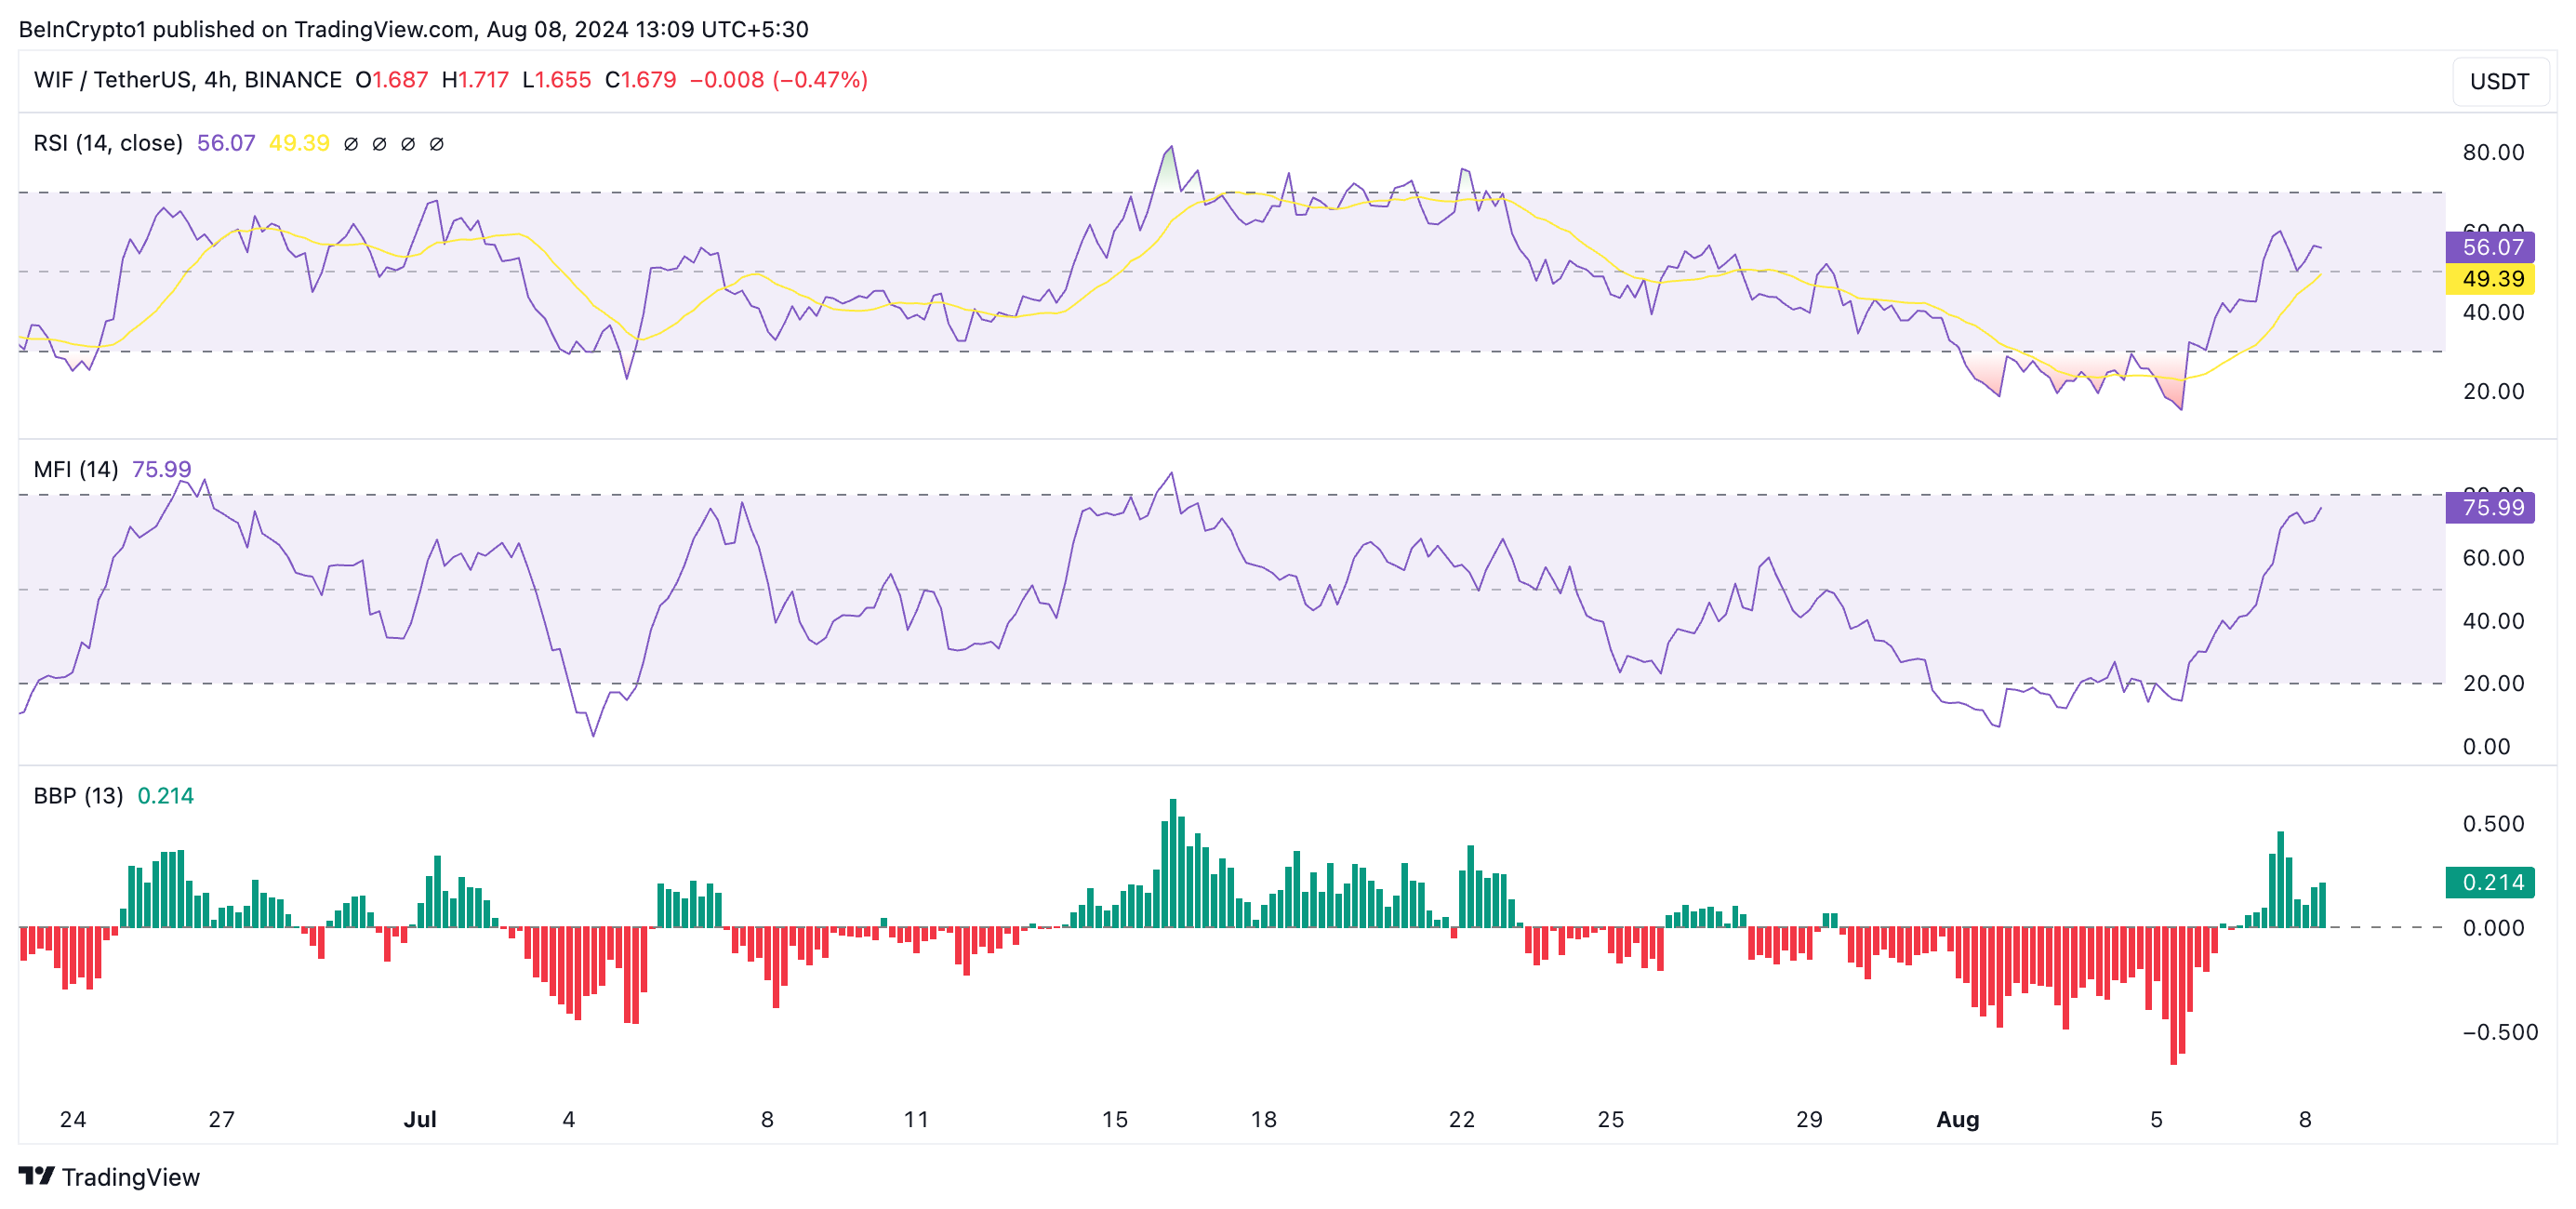
As of this writing, the meme coin’s key momentum indicators are trending upwards above their respective 50-neutral lines. WIF’s Relative Strength Index (RSI) is 56.07, while its Money Flow Index (MFI) is 75.99.
These indicators measure an asset’s overbought and oversold market conditions. At their current values, WIF’s RSI and MFI signal that buying pressure dominates the meme coin’s market.
Further, WIF’s positive Elder-Ray Index confirms the bullish bias trailing the meme coin. At press time, the indicator’s value is 0.21, resting above the zero line.
An asset’s Elder-Ray Index measures the buying and selling pressure in the market and helps traders identify potential entry and exit points for their trades. When its value is positive, it suggests that an asset’s buyers control the market and are pushing prices higher. Traders interpret this as a potential for a continued price uptrend.

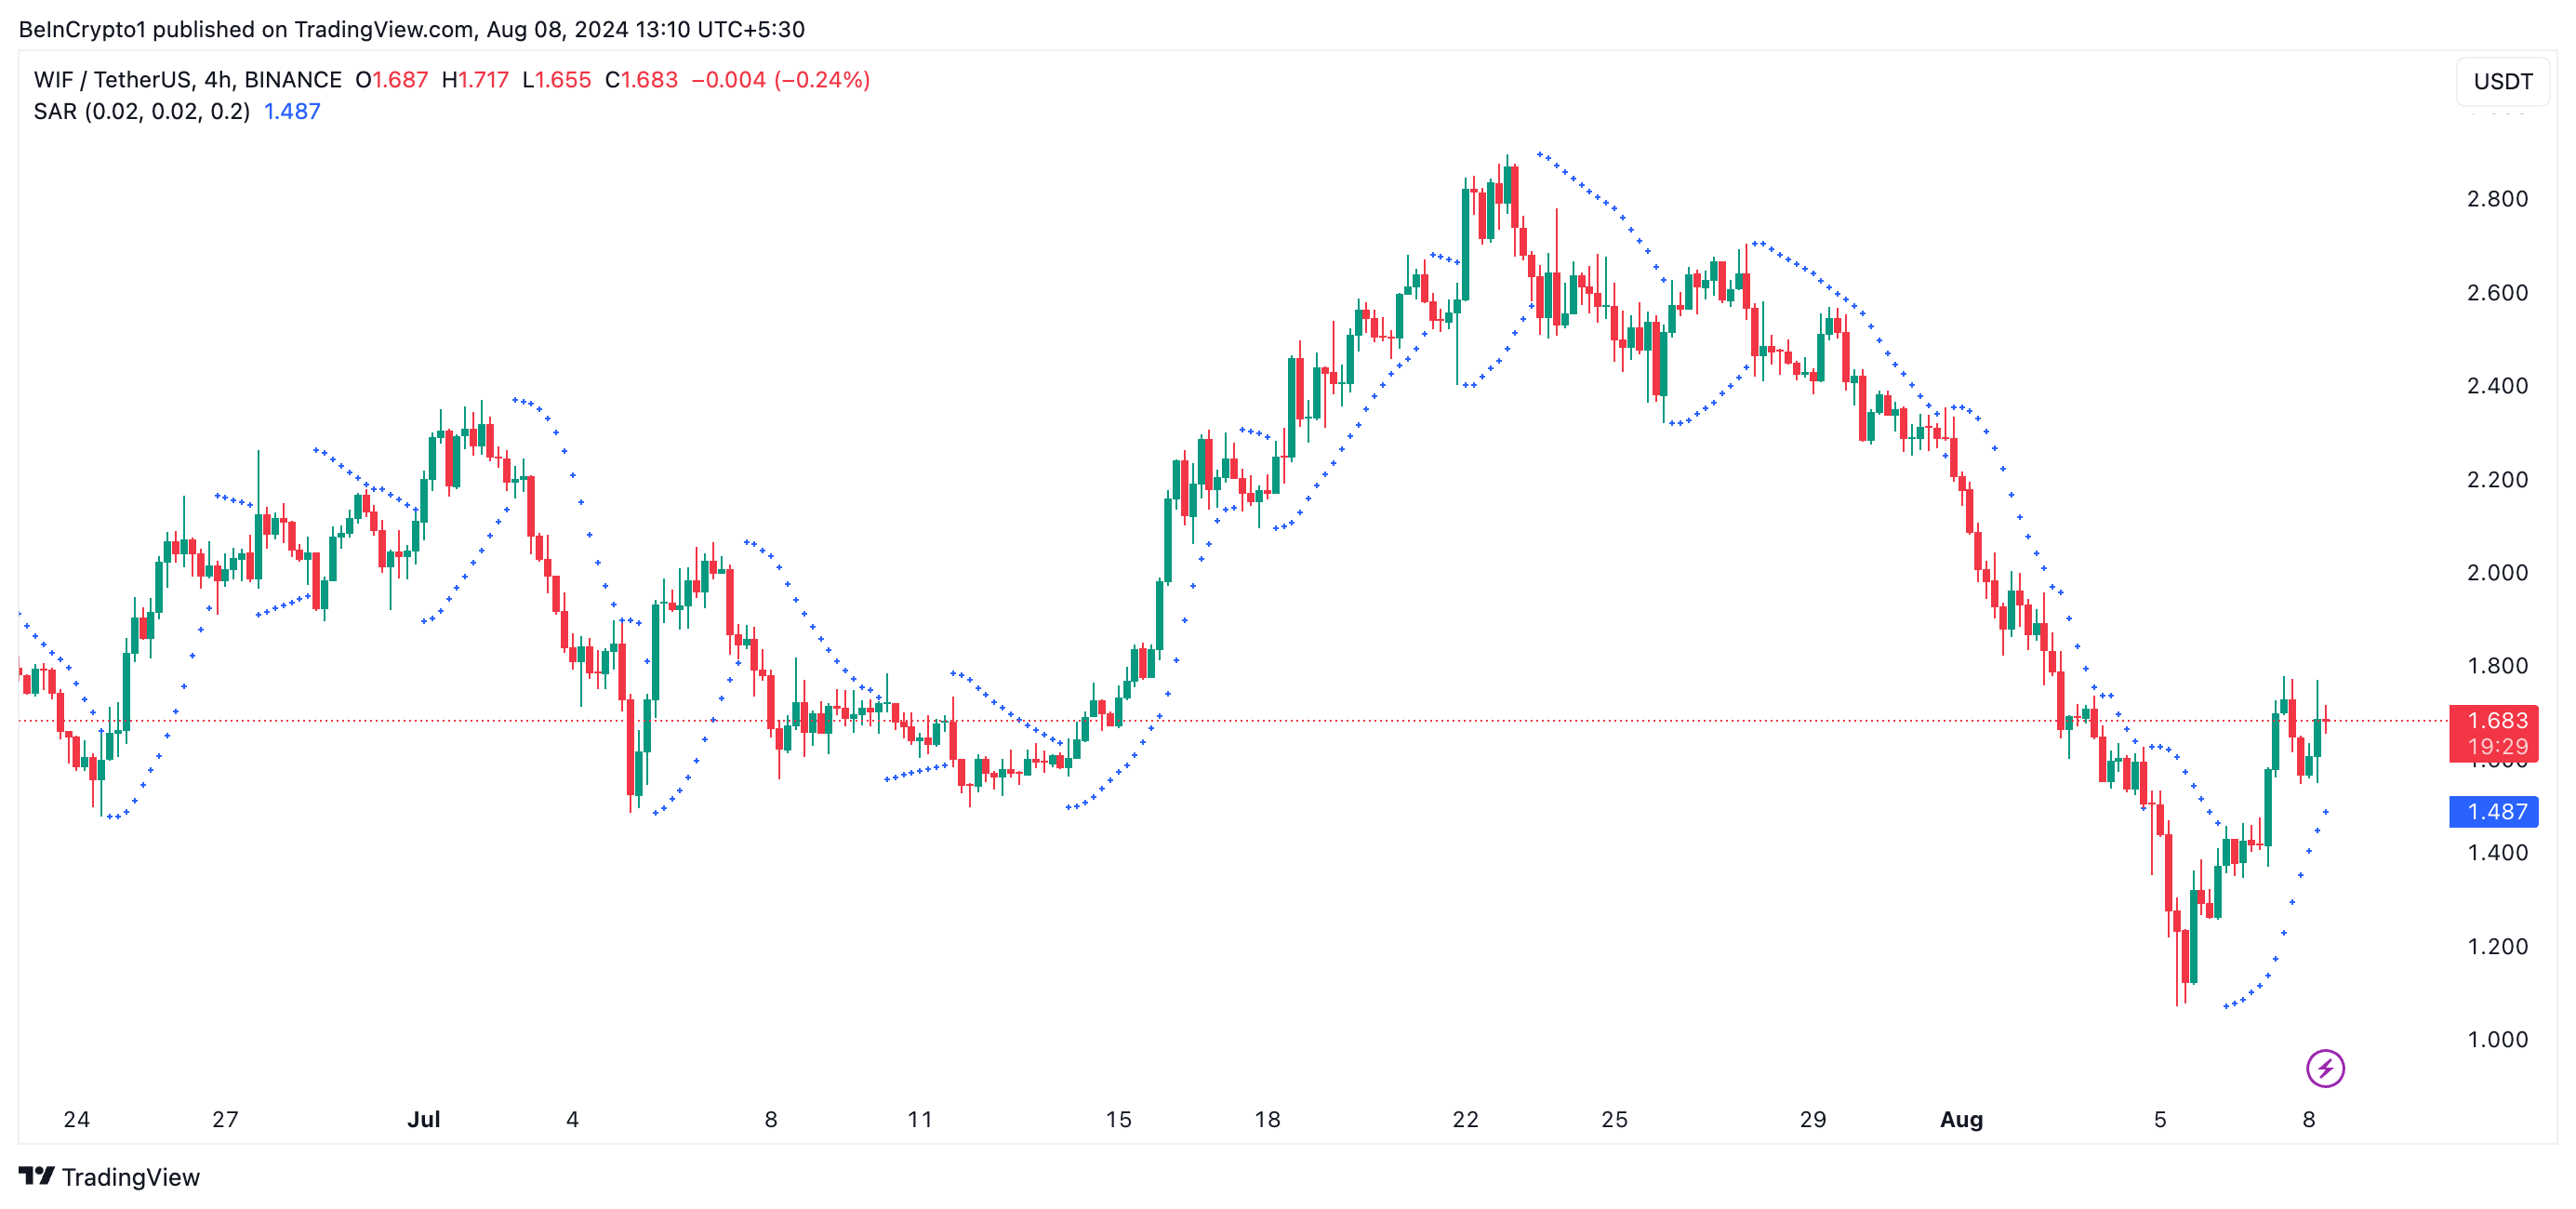
The setup of WIF’s Parabolic Stop and Reverse (SAR) indicator lends credence to the position above. As of this writing, the dots of this indicator rest below the meme coin’s price.
Read More: 5 Best Dogwifhat (WIF) Wallets To Consider In 2024

The Parabolic SAR indicator identifies potential trend direction and price reversal points. When its dotted lines are placed below an asset’s price, the market is said to be in an uptrend. This indicates that the asset’s price has risen, and the rally may continue.
WIF Price Prediction: Road to $2?
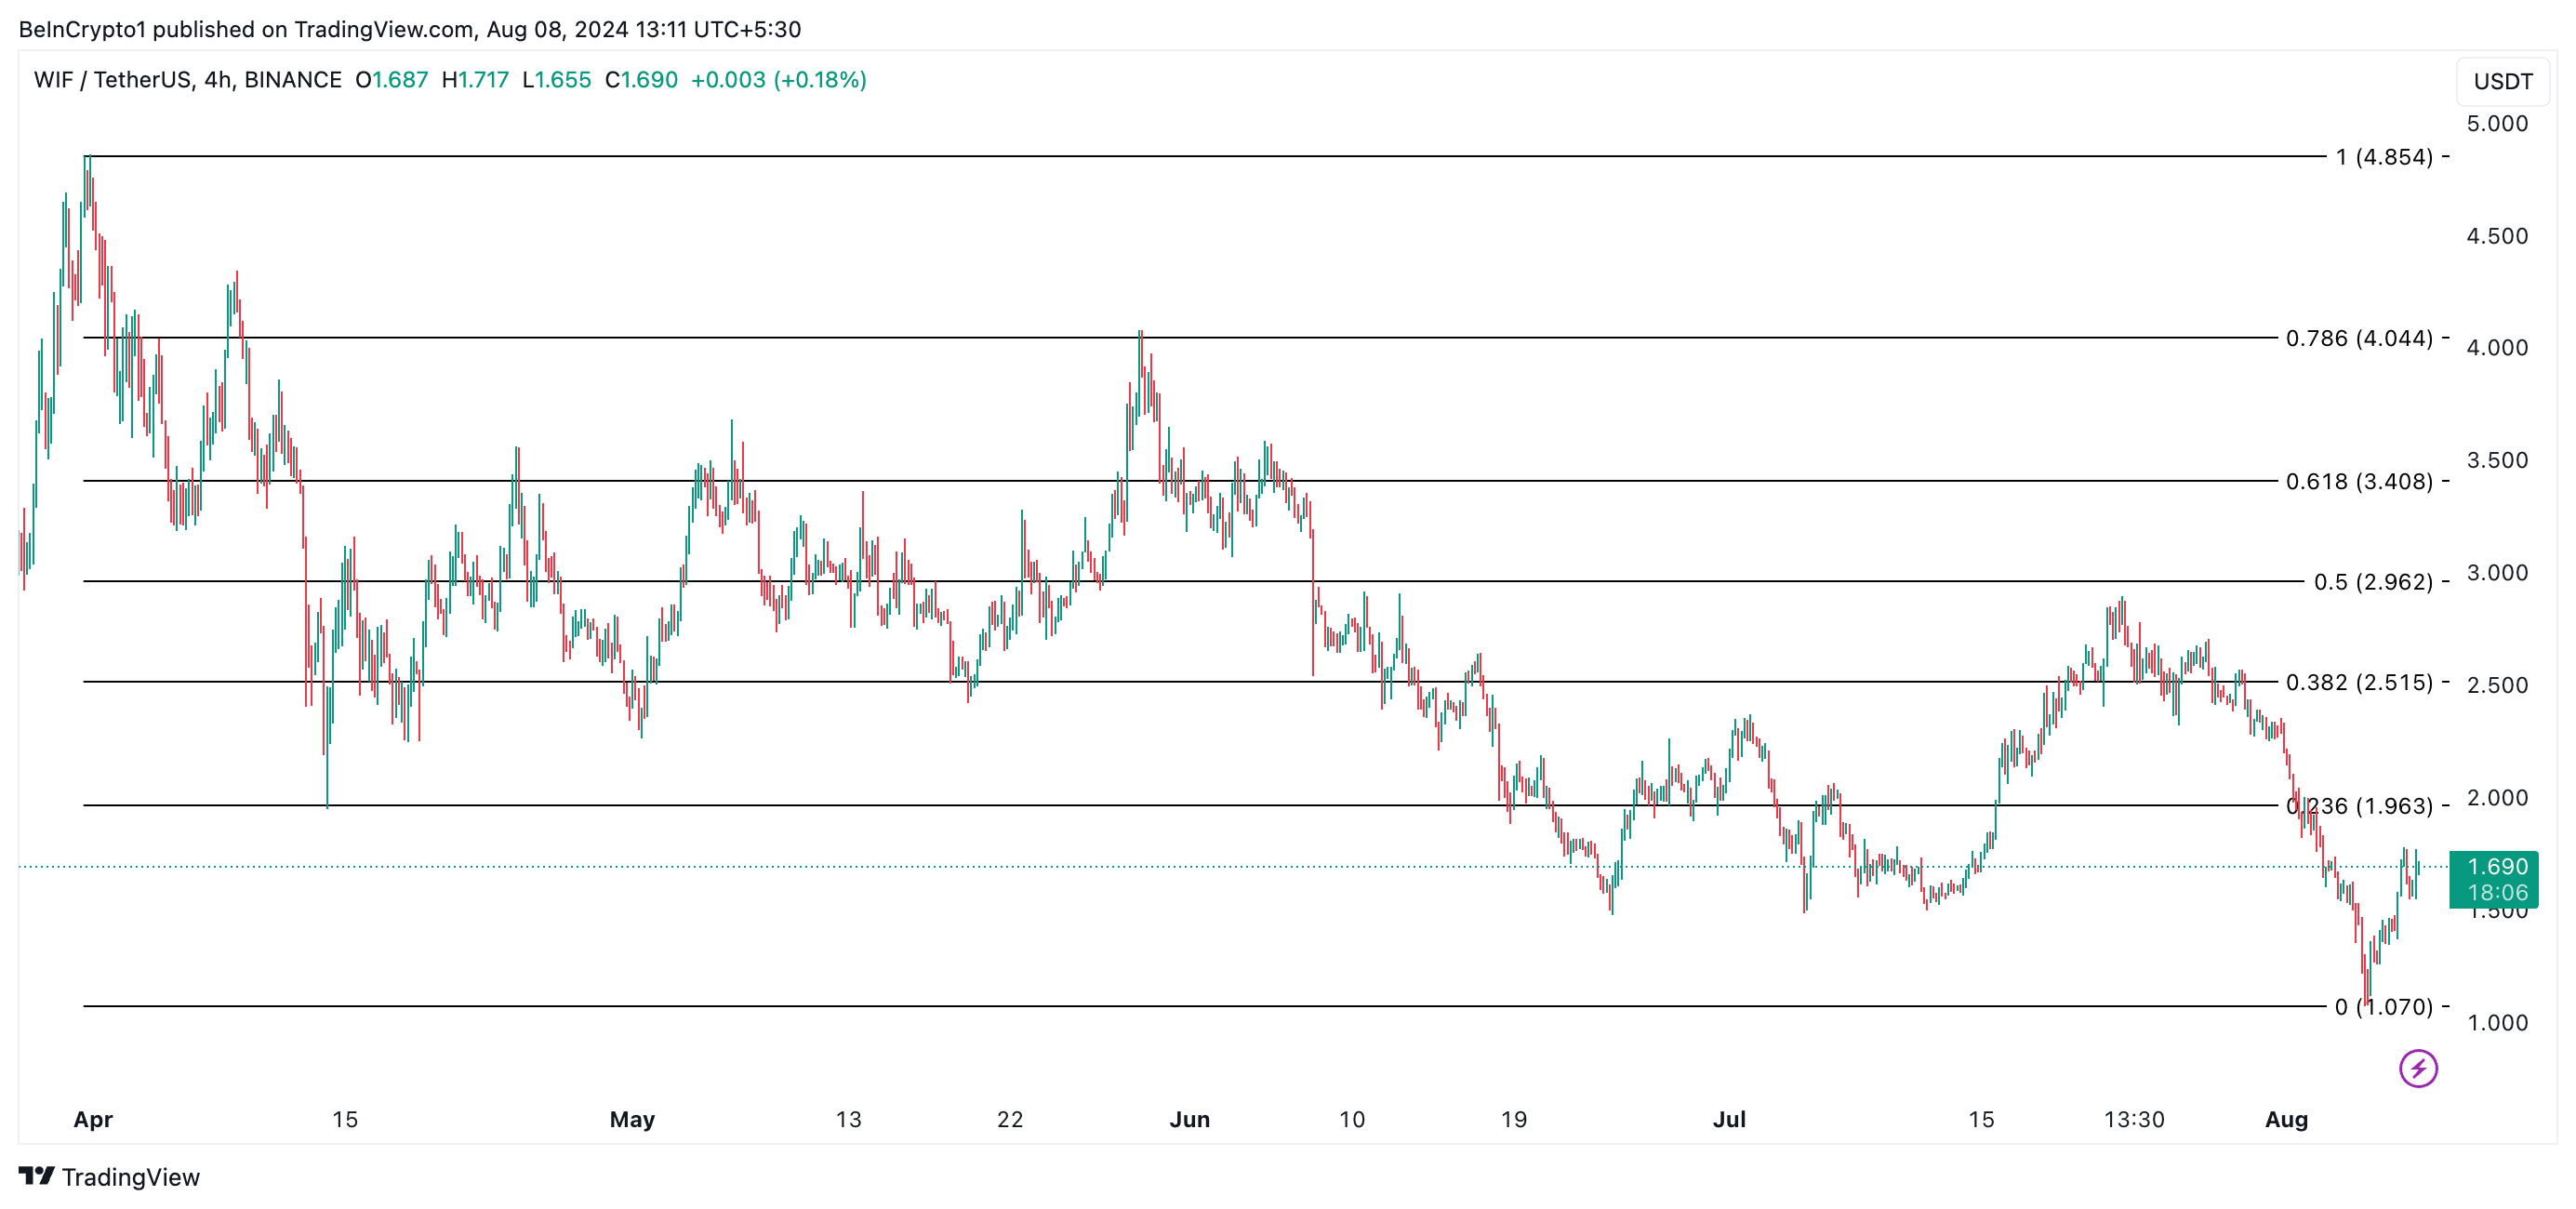
If WIF maintains its current uptrend, its next price target is $1.99. The continued demand for WIF and bullish sentiment among its traders will cause its price to reclaim the $2 price level and trade above it.
Read More: What Is Dogwifhat (WIF)?

However, any reversal in the current trend might put downward pressure on WIF’s price. This may cause it to drop to $1.07, a low last recorded during the general market downturn on Monday.
Trusted
Disclaimer
In line with the Trust Project guidelines, this price analysis article is for informational purposes only and should not be considered financial or investment advice. BeInCrypto is committed to accurate, unbiased reporting, but market conditions are subject to change without notice. Always conduct your own research and consult with a professional before making any financial decisions. Please note that our Terms and Conditions, Privacy Policy, and Disclaimers have been updated.