Ethereum at a crossroads: Will ETH rally to $3,625 or correct to $2,350?
08/17/2024 02:30
Ethereum shows resilience with bullish potential as adoption remains steady and price nears critical resistance levels.
- Ethereum nears critical resistance at $2,800, with bullish potential for a breakout towards $3,000.
- Positive adoption trends and exchange outflows suggest growing interest and reduced supply on trading platforms.
Ethereum’s [ETH] price remained in a precarious position, with a market analyst suggesting the possibility of a correction.
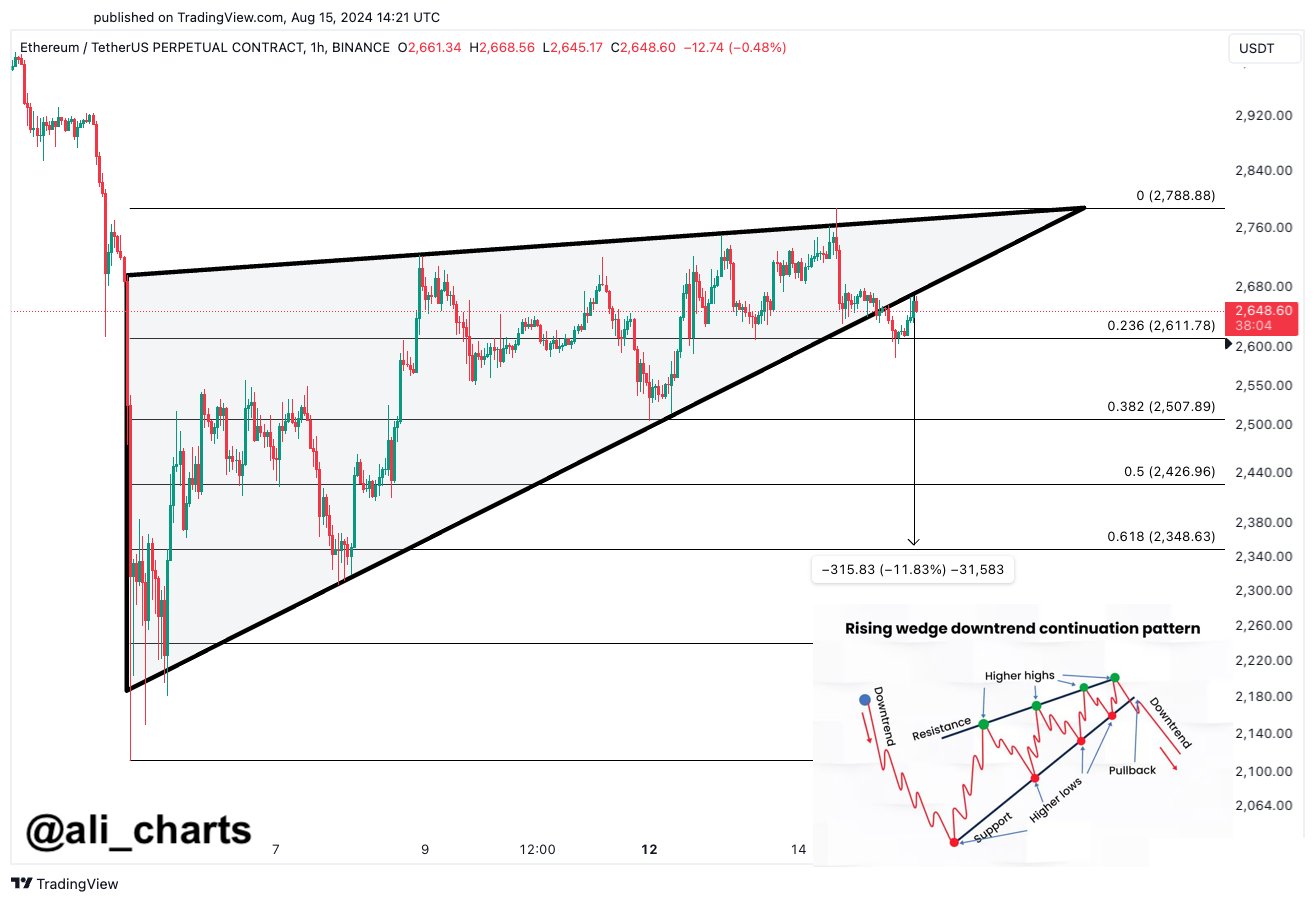
According to Ali, a market analyst, Ethereum may be forming a rising wedge pattern, which is a bearish technical indicator.
Ali noted,
“If #Ethereum is indeed forming a rising wedge, this could be the pullback before a possible correction to $2,350.”
He further pointed out that the bearish outlook could shift if Ethereum manages to close above $2,800.
As of press time, Ethereum was trading at $2,615.66, reflecting a 0.14% increase in the last 24 hours.
However, over the past seven days, Ethereum has experienced a -2.86% decline, raising concerns about the short-term market outlook.
Ethereum’s press time market capitalization stood at $314.79 billion, with a trading volume of $15.46 billion in the past 24 hours.
Price targets and key levels to watch
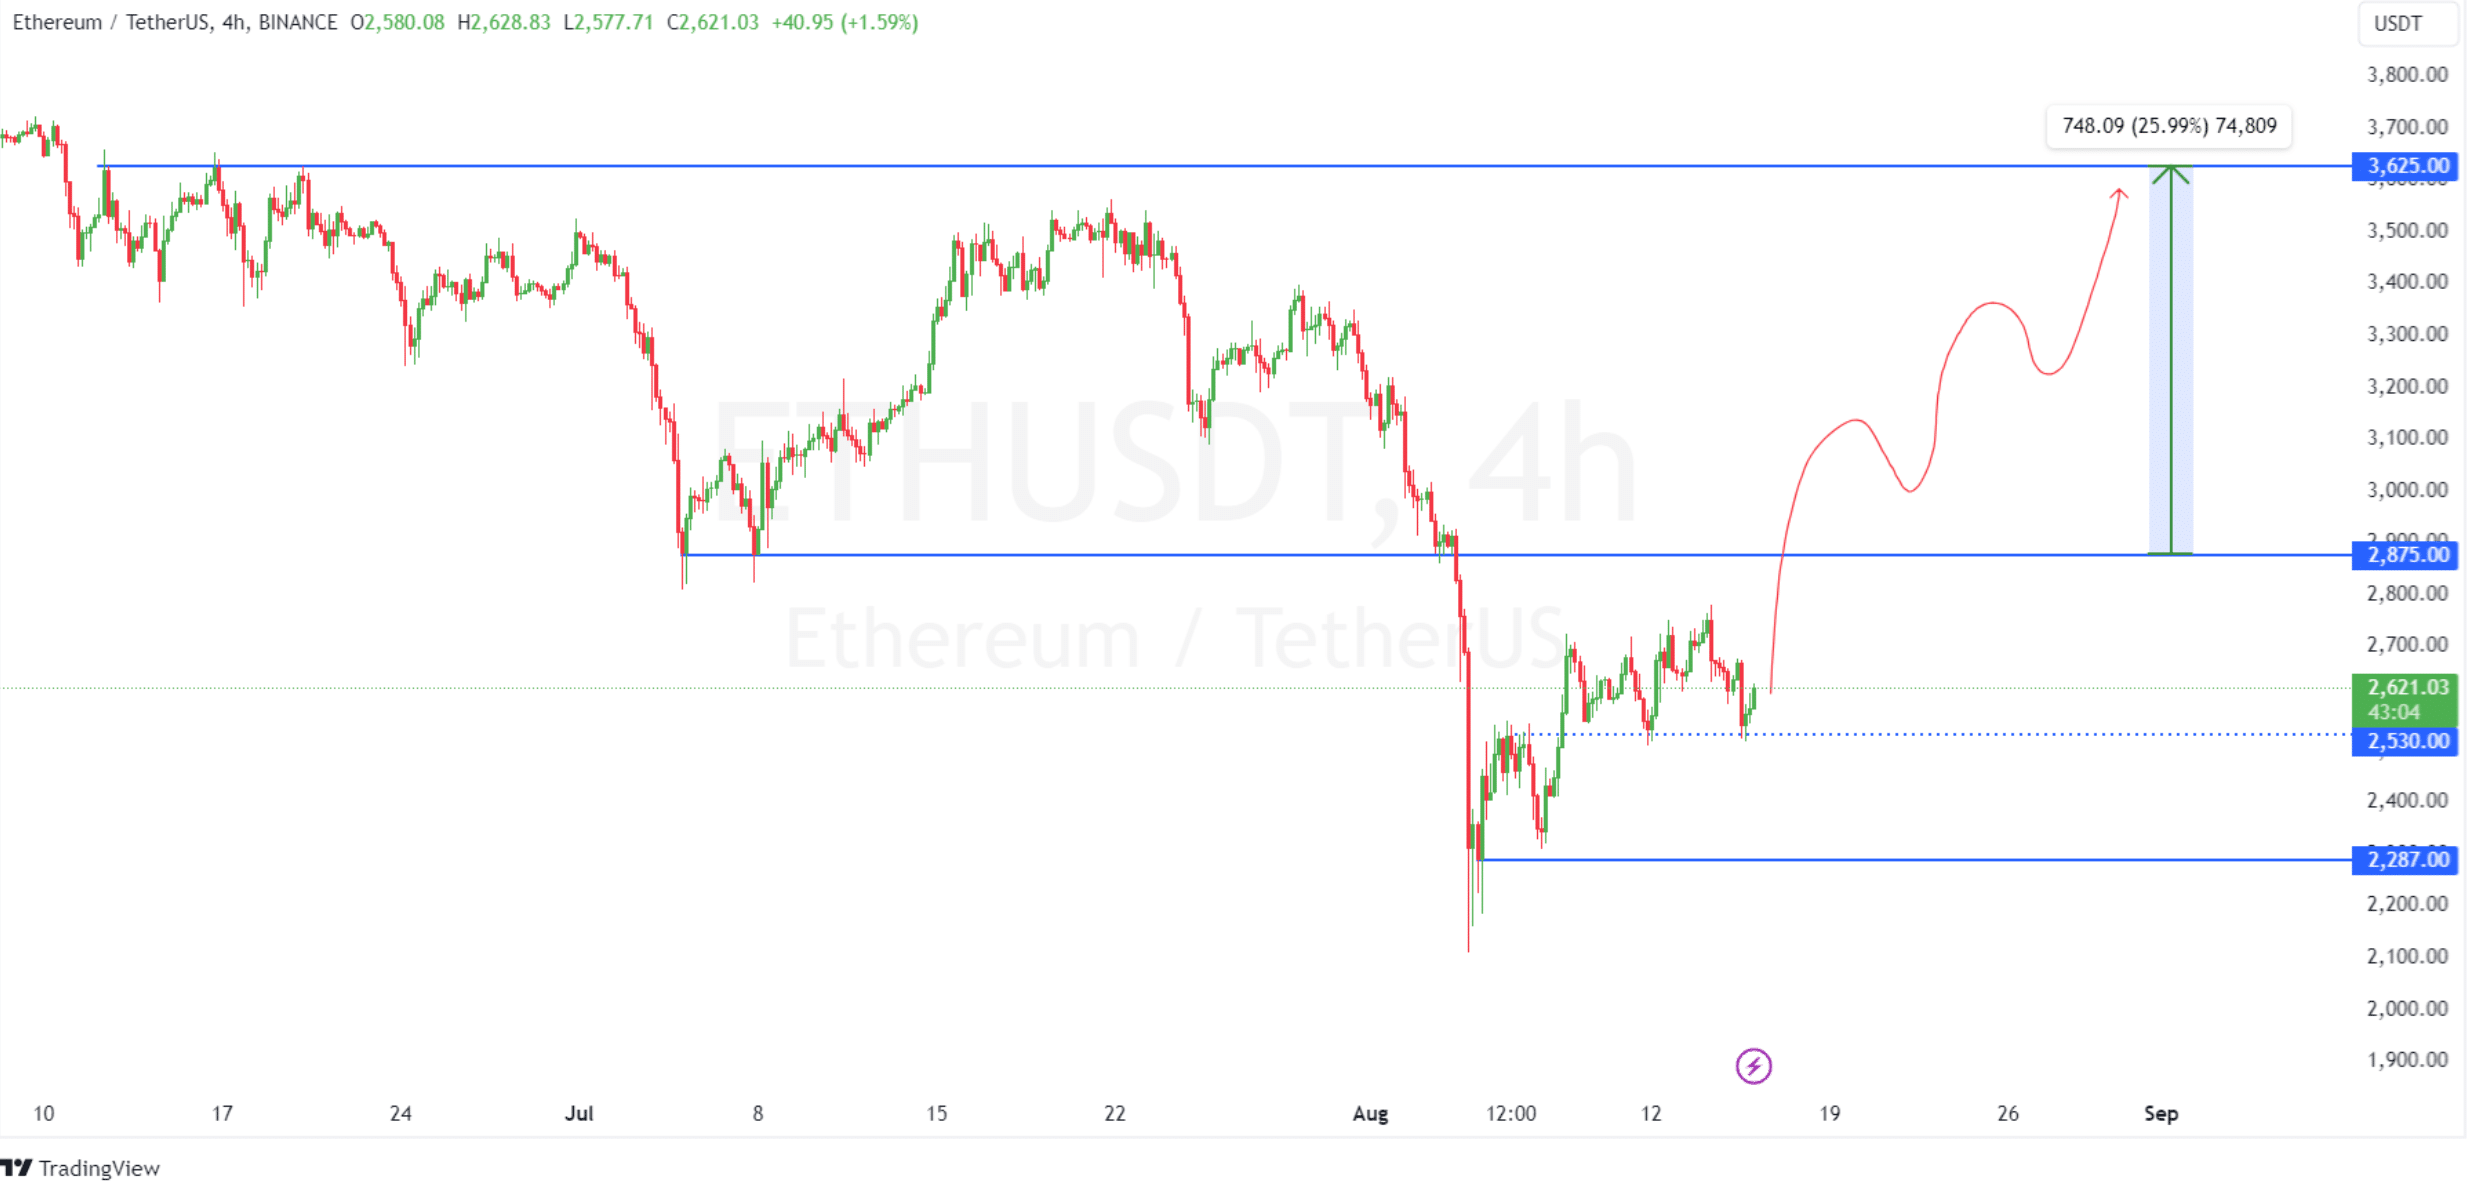
The price chart for Ethereum suggested a potential bullish surge, with projections indicating a possible rise toward the 3,000 level.
If the upward momentum continues, Ethereum could reach as high as $3,625, marking a 25.99% increase from its current price point.
However, for this bullish trend to materialize, Ethereum would need to overcome key resistance levels.
Immediate resistance is seen at $2,875, a critical level that must be surpassed to advance toward higher price targets.
Should Ethereum manage to break through this resistance, the next significant barrier is the $3,000 mark.
Beyond that, the $3,625 zone could be the final target for this potential upward movement.
Conversely, on the downside, support levels at $2,530 and $2,287 provide potential reversal points if the market faces downward pressure.
Ethereum’s showdown
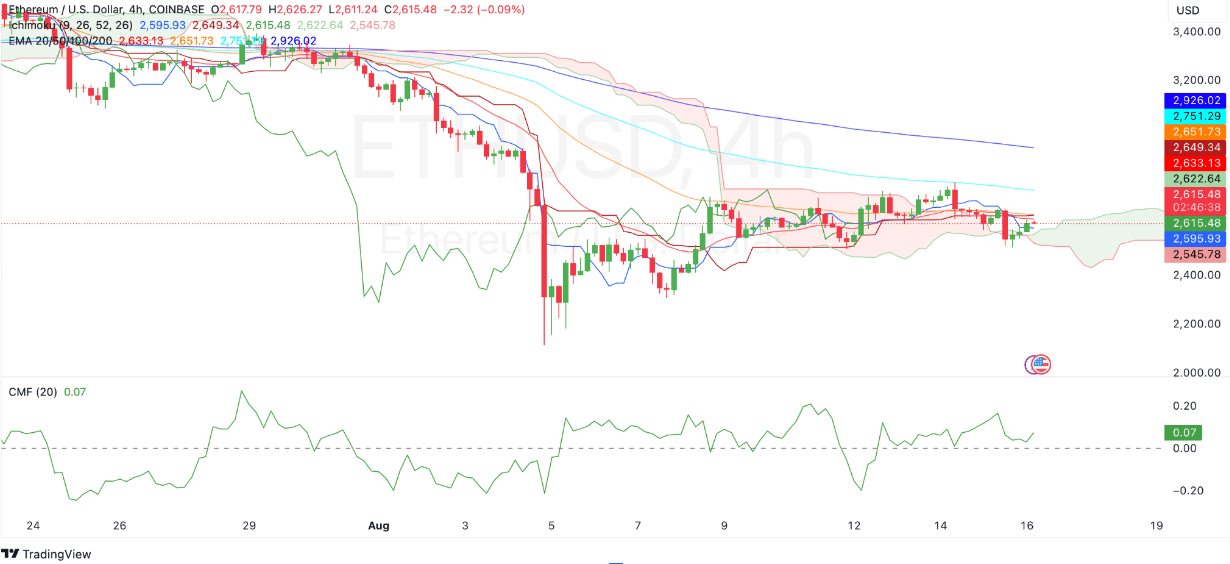
Technical indicators show Ethereum battling overhead resistance.
The price sat at $2,617.03 at press time, while the Ichimoku cloud revealed that Ethereum needs to clear further resistance before a sustained upward trend can be confirmed.
Moreover, the 50-period EMA (Exponential Moving Average) at $2,633.28 and the 100-period EMA at $2,751.32 present additional resistance.
Ethereum needs to surpass these levels for any significant upward movement to continue. If Ethereum breaks above these EMAs, it may attempt to reach the next level of resistance at $2,926.04.
Failure to do so could result in consolidation or a potential pullback as Ethereum struggles to maintain bullish momentum.
Ethereum outflows surge
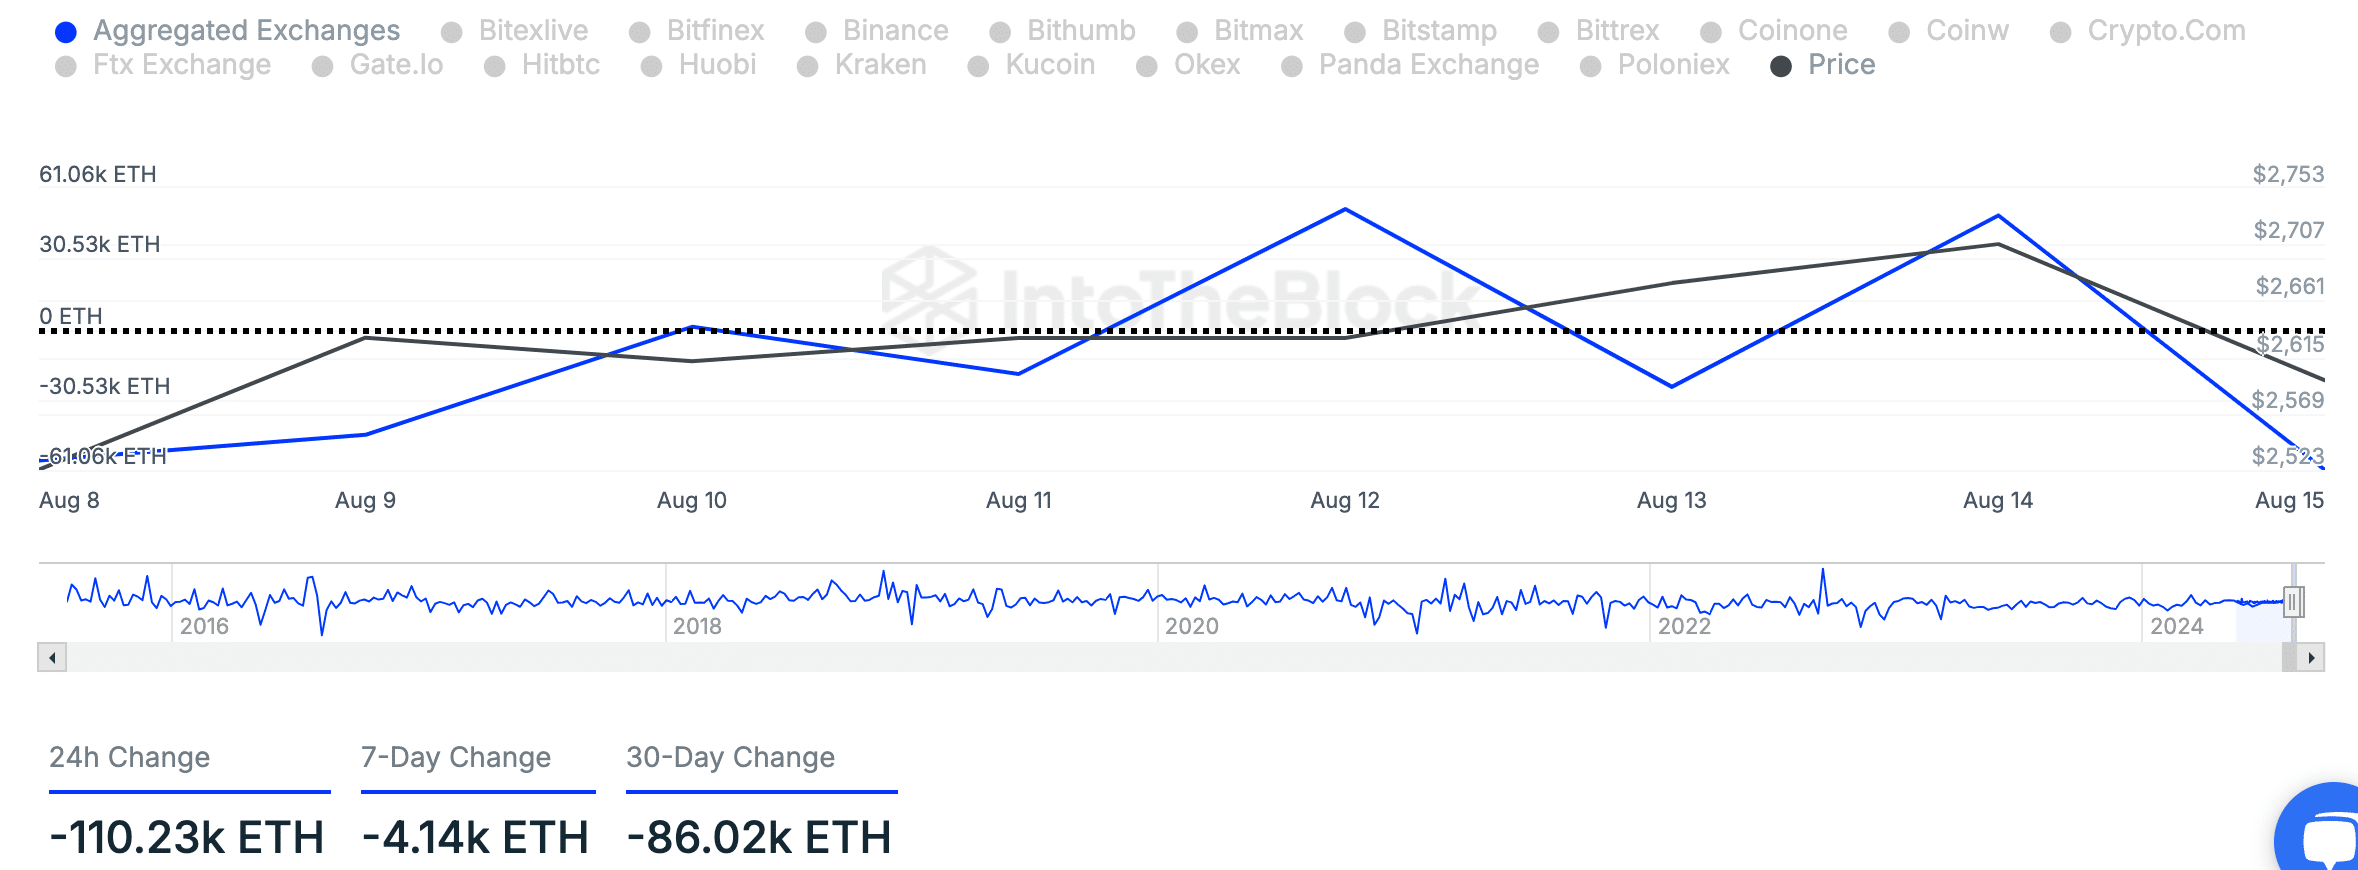
Recent netflow data from IntoTheBlock showed a consistent outflow of Ethereum from exchanges.
Over the past seven days, a net outflow of -4.14k ETH has been recorded, indicating a reduction in available supply on trading platforms.
This trend aligned with the broader 30-day outflow of -86.02k ETH, suggesting that investors may be moving their assets into cold storage or decentralized finance (DeFi) platforms.
The 24-hour netflow change of -110.23k ETH further signaled strong selling pressure or accumulation, which could influence Ethereum’s price dynamics.
These outflows might lead to reduced liquidity, which could result in price volatility in the near future.
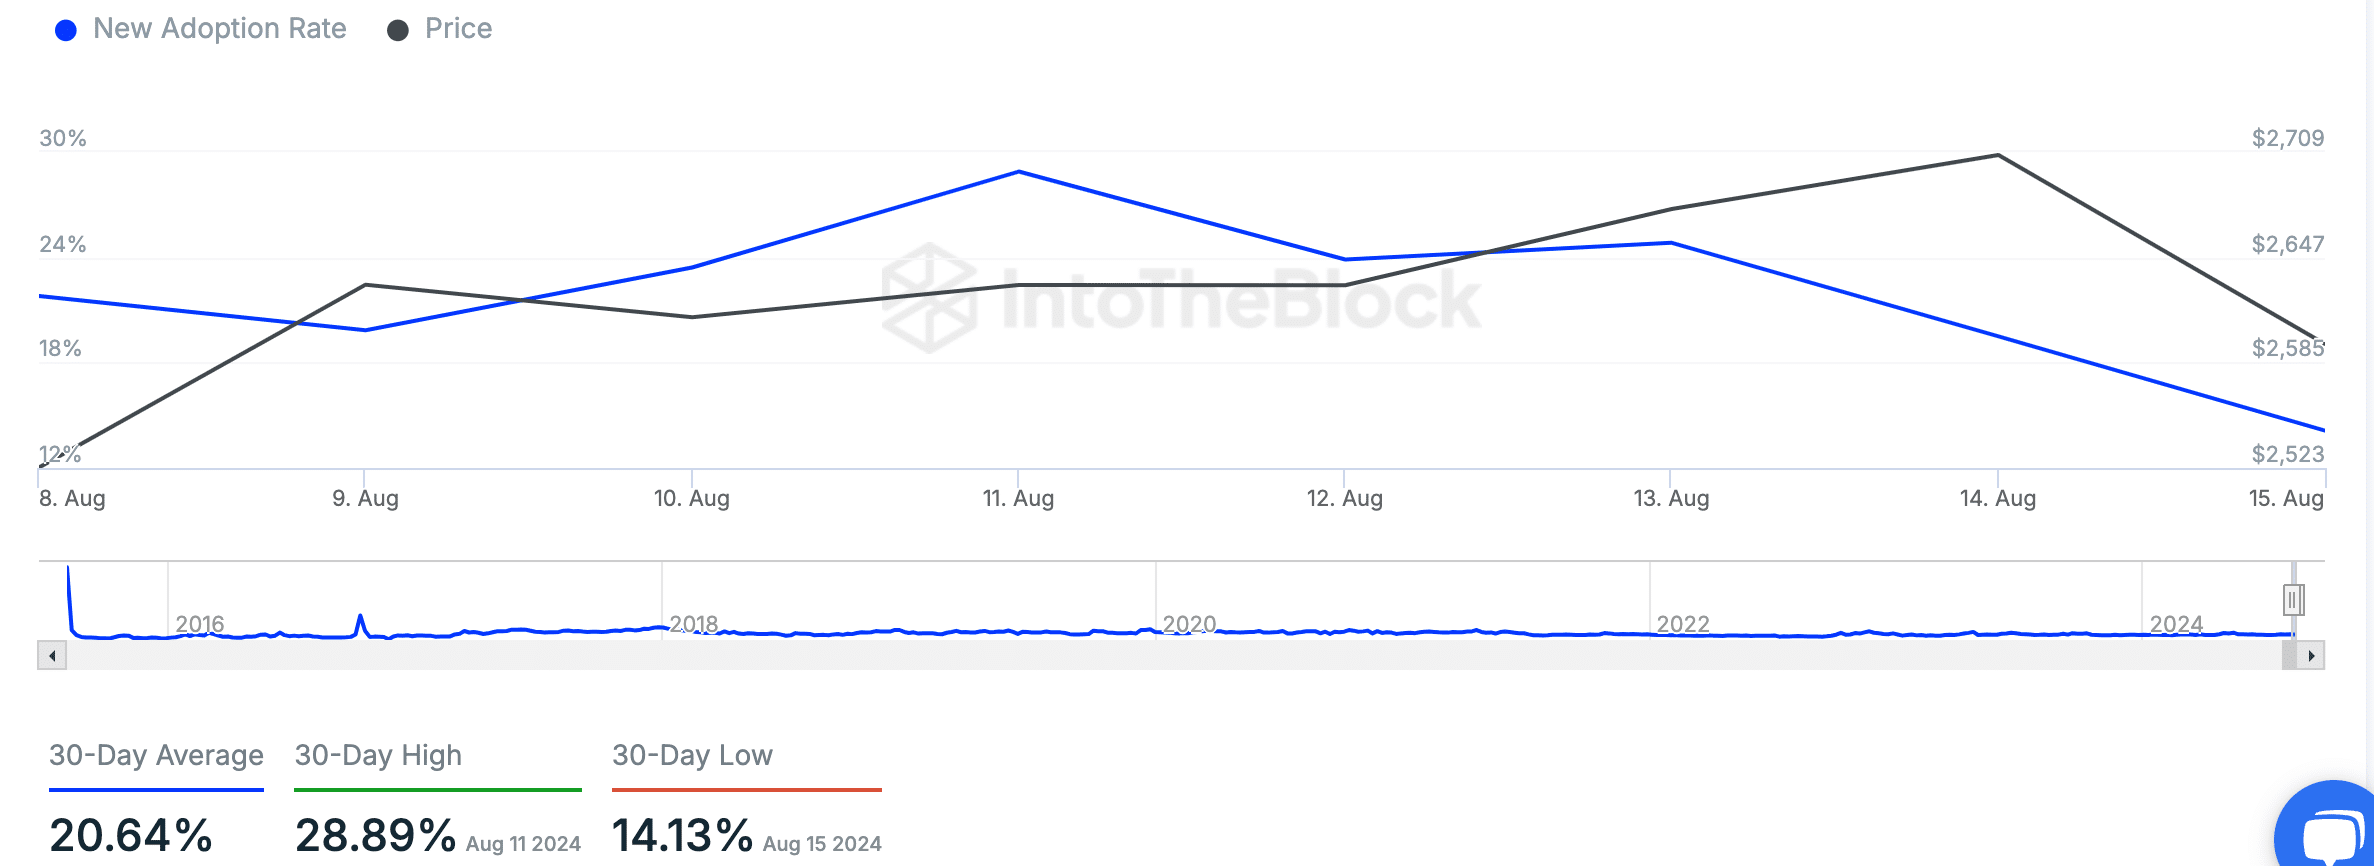
Also, Ethereum’s new adoption rate has been fluctuating. It peaked at 28.89% on the 11th of August before falling to a 30-day low of 14.13% on the 15th of August.
Read Ethereum’s [ETH] Price Prediction 2024-25
Despite this decline, the 30-day average remained healthy at 20.64%, indicating sustained interest in Ethereum’s network.
The price of Ethereum and its adoption rate seem to be moving in tandem, with both experiencing a rise and subsequent decline over the same period.
