DXY Crash: Why Isn't Crypto Skyrocketing? Shiba Inu (SHIB) Finally Reaches Major Resistance, Is Bitcoin (BTC) Forming Double Top Pattern?
08/22/2024 22:50
Market is indeed seeing recovery, but its fundamental strength could be gone

Disclaimer: The opinions expressed by our writers are their own and do not represent the views of U.Today. The financial and market information provided on U.Today is intended for informational purposes only. U.Today is not liable for any financial losses incurred while trading cryptocurrencies. Conduct your own research by contacting financial experts before making any investment decisions. We believe that all content is accurate as of the date of publication, but certain offers mentioned may no longer be available.
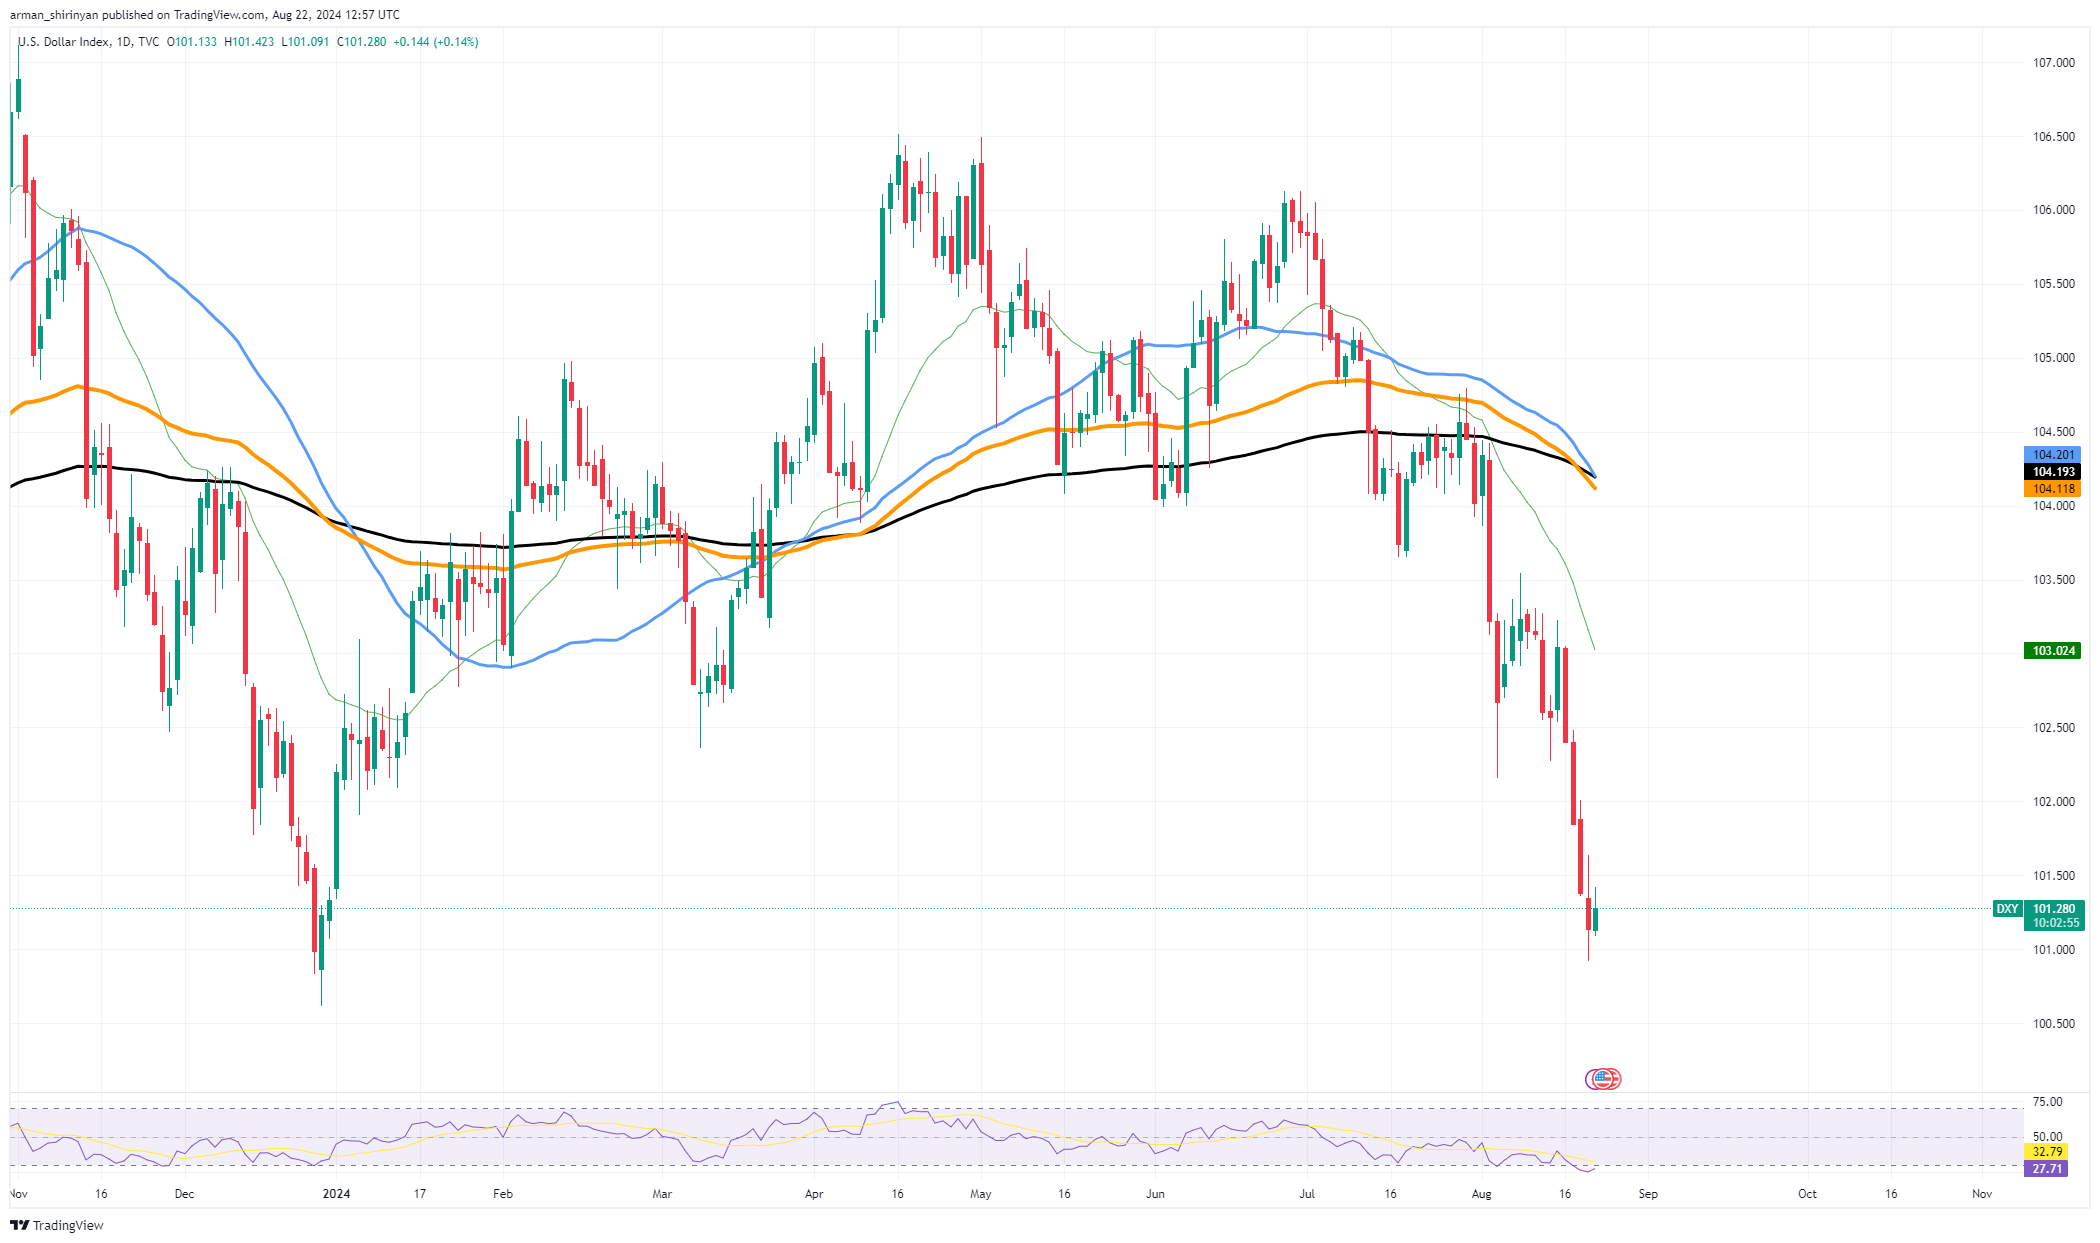
Historically, U.S cryptocurrency market performance and the Dollar Index (DXY) have a pronounced negative correlation. Rallying in Bitcoin and other cryptocurrencies was frequently the result of a decline in the DXY. This relationship made sense because declining dollar values usually cause investors to turn to alternative assets like cryptocurrency.

It appears that the current state of the market is breaking this pattern, though. Given that the DXY has dropped significantly and has recently reached all-time lows, it is reasonable to anticipate that Bitcoin and the larger cryptocurrency market will rise sharply in response.
The dynamic nature of the cryptocurrency market itself may be one cause of this broken link. The market grows increasingly complex as it ages, impacted by more variables than just the DXY. Today's cryptocurrency prices are greatly influenced by regulatory changes, market sentiment and macroeconomic uncertainty.
The cautious attitude that has been prevalent on the market lately may also be a contributing factor. The market's recent volatile regulatory actions and persistent worries about the stability of the global economy may make investors wary of investing in riskier assets like cryptocurrencies. The usual excitement that a declining DXY would have generated may be tempered by this cautious approach.
Shiba Inu finally hits resistance
Shiba Inu hit the 26-day Exponential Moving Average (EMA), a key resistance level that traders are keeping a close eye on. This is the first significant obstacle that SHIB needs to clear in order to maintain its upward trajectory and perhaps pave the way for future gains.
SHIB's successful break above the $0.000014 price level, which served as a crucial support and gave the current rally the required impetus, has led to the approach of this resistance level. The breach of the crucial $0.000014 level has encouraged traders and SHIB holders to be optimistic, as it may indicate that the cryptocurrency is ready to move higher.
Still, the 26 EMA is a significant obstacle. This moving average has demonstrated its ability to accurately predict trend continuations or reversals in the past. A more persistent uptrend may begin if SHIB is able to break above this resistance. On the other hand, if this level is not reached, there could be a retreat or consolidation, which would expose SHIB to further downside pressure.
With recent increases in trading volume and renewed interest from the larger crypto community, market sentiment surrounding Shiba Inu has been cautiously optimistic. The price might rise even more as a result of the successful 26 EMA breach drawing in more buyers. The current resistance level, however, may also act as a point of rejection that could cause the rally to halt momentarily. As such, traders should exercise caution.
Is Bitcoin topping out?
Bitcoin might be about to form a local double top pattern, which is a technical pattern that usually indicates a bearish market reversal. This pattern is frequently interpreted by traders as a warning sign, suggesting that the recent bullish rally may be coming to an end and that a price retracement at current levels may ensue.
When the price of an asset reaches a certain level, it pulls back then rises to the same level before declining again; this pattern is known as a double top. Two roughly equal peaks, or tops, are produced as a result, indicating that the market has failed to overcome a significant resistance level. This pattern is starting to show up in the case of Bitcoin at the $62,000 mark, which has proven to be resistance on several occasions. As a sign that there may not be enough buying momentum to drive the price higher, the possible formation of this double top pattern worries proponents of Bitcoin.
Investors ought to exercise caution and keep a close eye on the price action because a break below the double top's neckline — the point where the two peaks meet — could lead to additional selling pressure. The market is responding as expected, even though it is still too soon to declare with certainty that a double top has formed.
