Ethereum (ETH) Traders Offload Their Coins Amid Rising Exchange Reserves
09/03/2024 00:00
Ethereum (ETH) has witnessed a gradual spike in its exchange reserve in the past few days, suggesting an uptick in selling pressure.
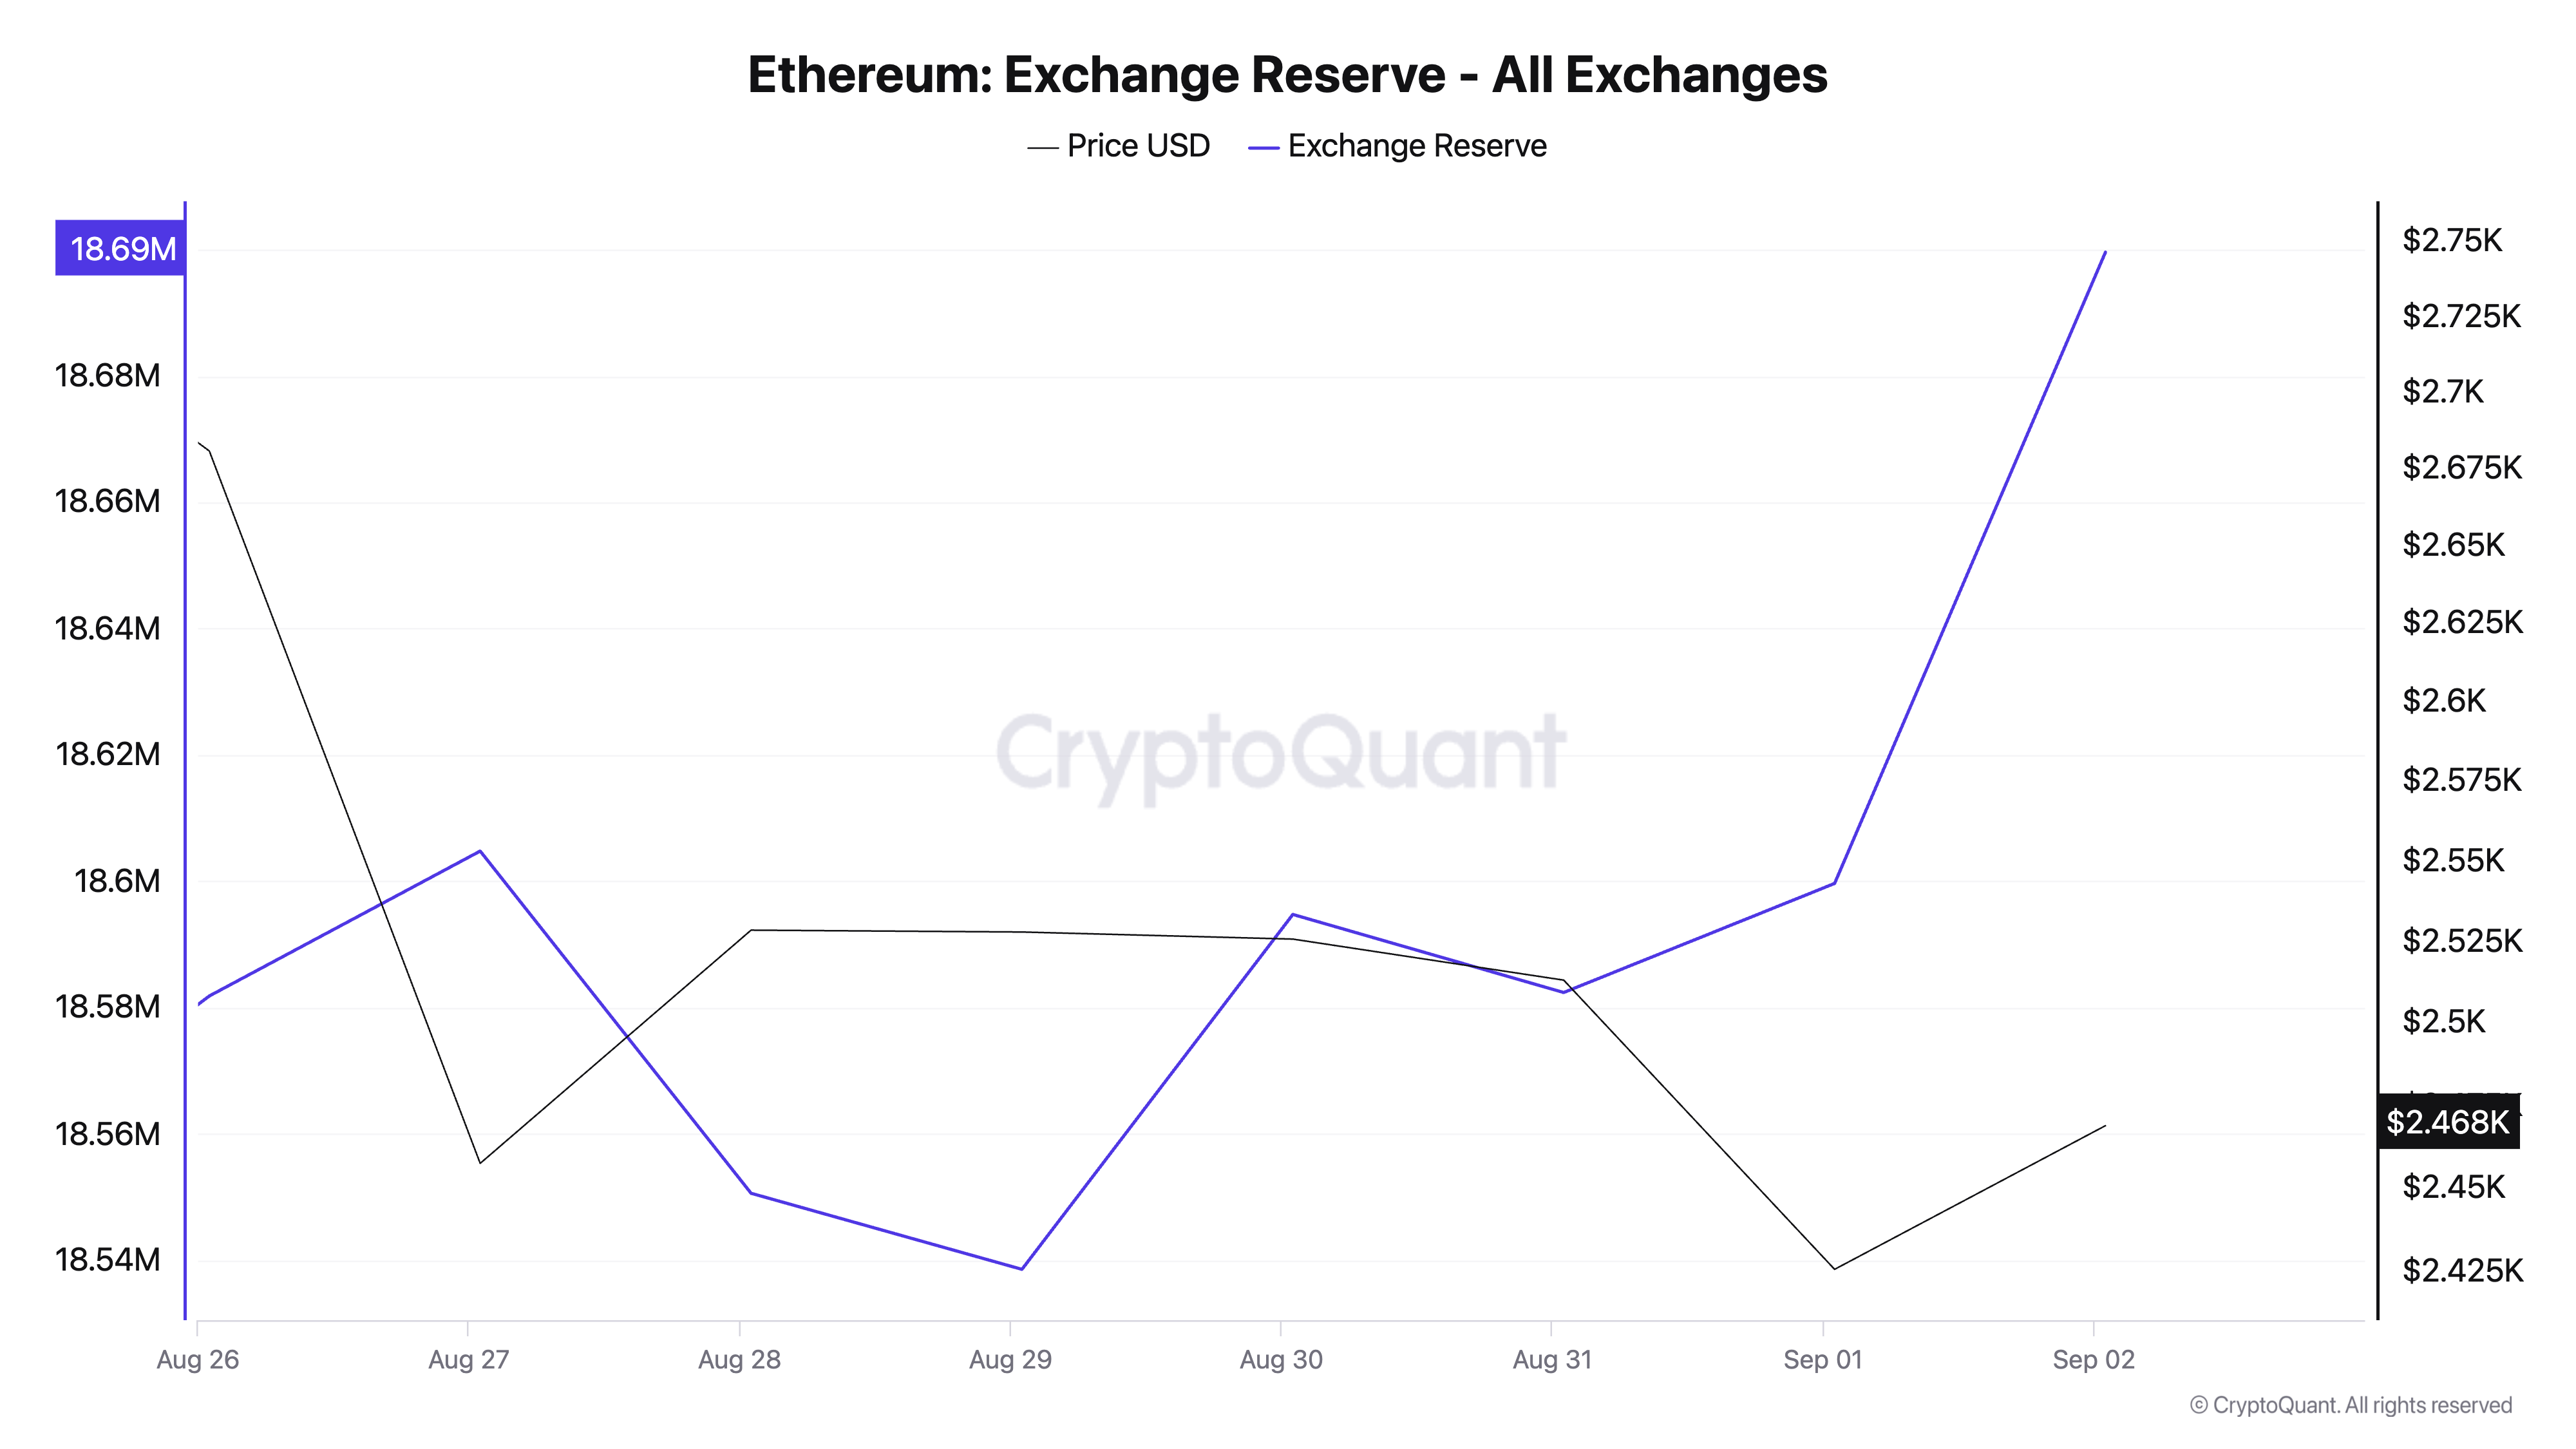
Since August 31, the amount of Ethereum (ETH) sent to exchanges has been gradually increasing. This surge coincides with ETH facing strong resistance at the $2,750 price level.
As of now, ETH is trading at $2,466. If selling pressure continues to mount, ETH risks further decline.
Ethereum Holders Send Coins To Exchanges
As ETH faces strong resistance at $2,750, holders are increasingly sending their coins to exchanges, as shown by the rising exchange reserves. According to CryptoQuant, 19 million ETH, valued at $47 billion, are now held on exchange wallets — a 1.01% increase over the past week, the highest since August 22.

An asset’s exchange reserve tracks the total number of its coins or tokens held on cryptocurrency exchanges. A spike in this metric often suggests that holders are moving their assets to exchanges with the intent to sell. This results in a general uptick in selling pressure, leading to a price drop if the selling outweighs buying interest.
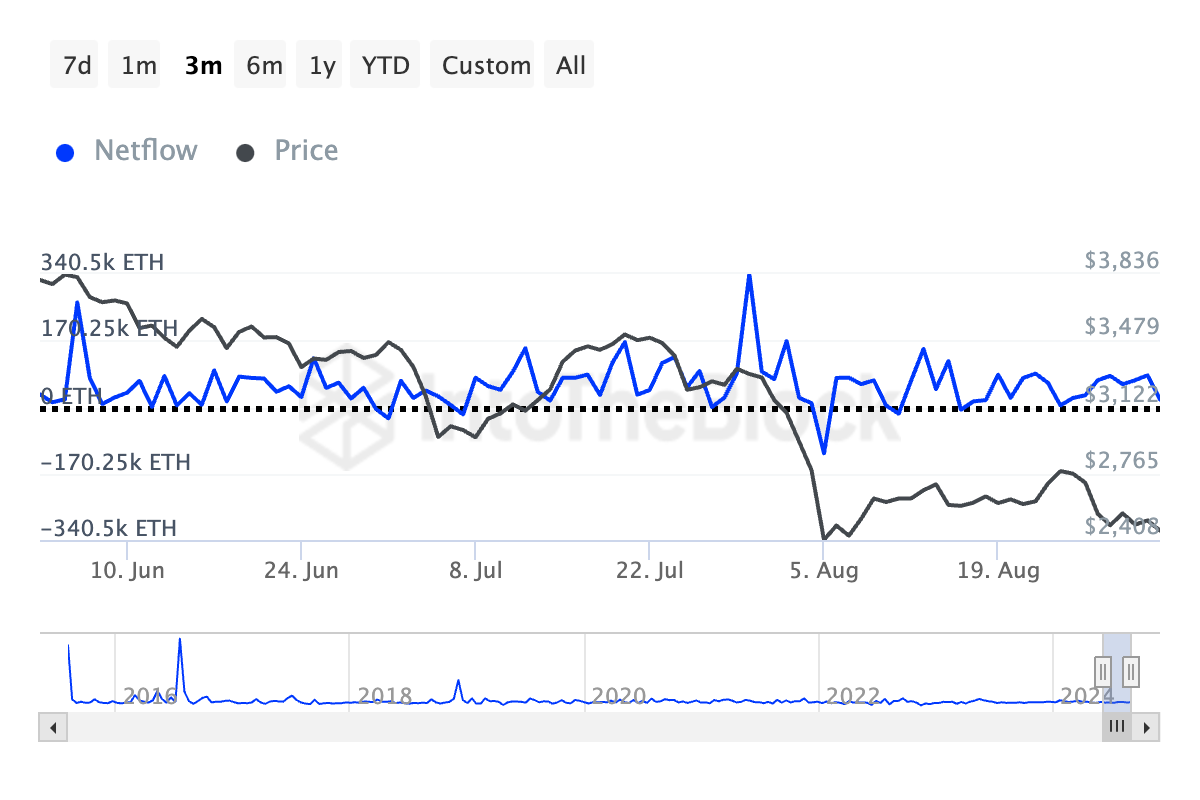
The decline in ETH’s large holders’ netflow confirms that its whales have also adopted a bearish approach. Since the coin’s price fell below $3000 at the beginning of August, they have gradually reduced their exposure. IntoTheBlock’s data shows that ETH’s large holders’ netflow has declined by 17% over the past 30 days and by 36% in the past week.
Read more: Ethereum (ETH) Price Prediction 2024/2025/2030

This metric measures the difference between the coins that large investors buy and the amount they sell over a specific period. When it falls, it signals a drop in whale holdings. It is a bearish signal, suggesting that the key holders are selling their coins. This often prompts retail investors to follow suit, exacerbating an asset’s price decline.
ETH Price Prediction: Coin Looks To Extend Losses
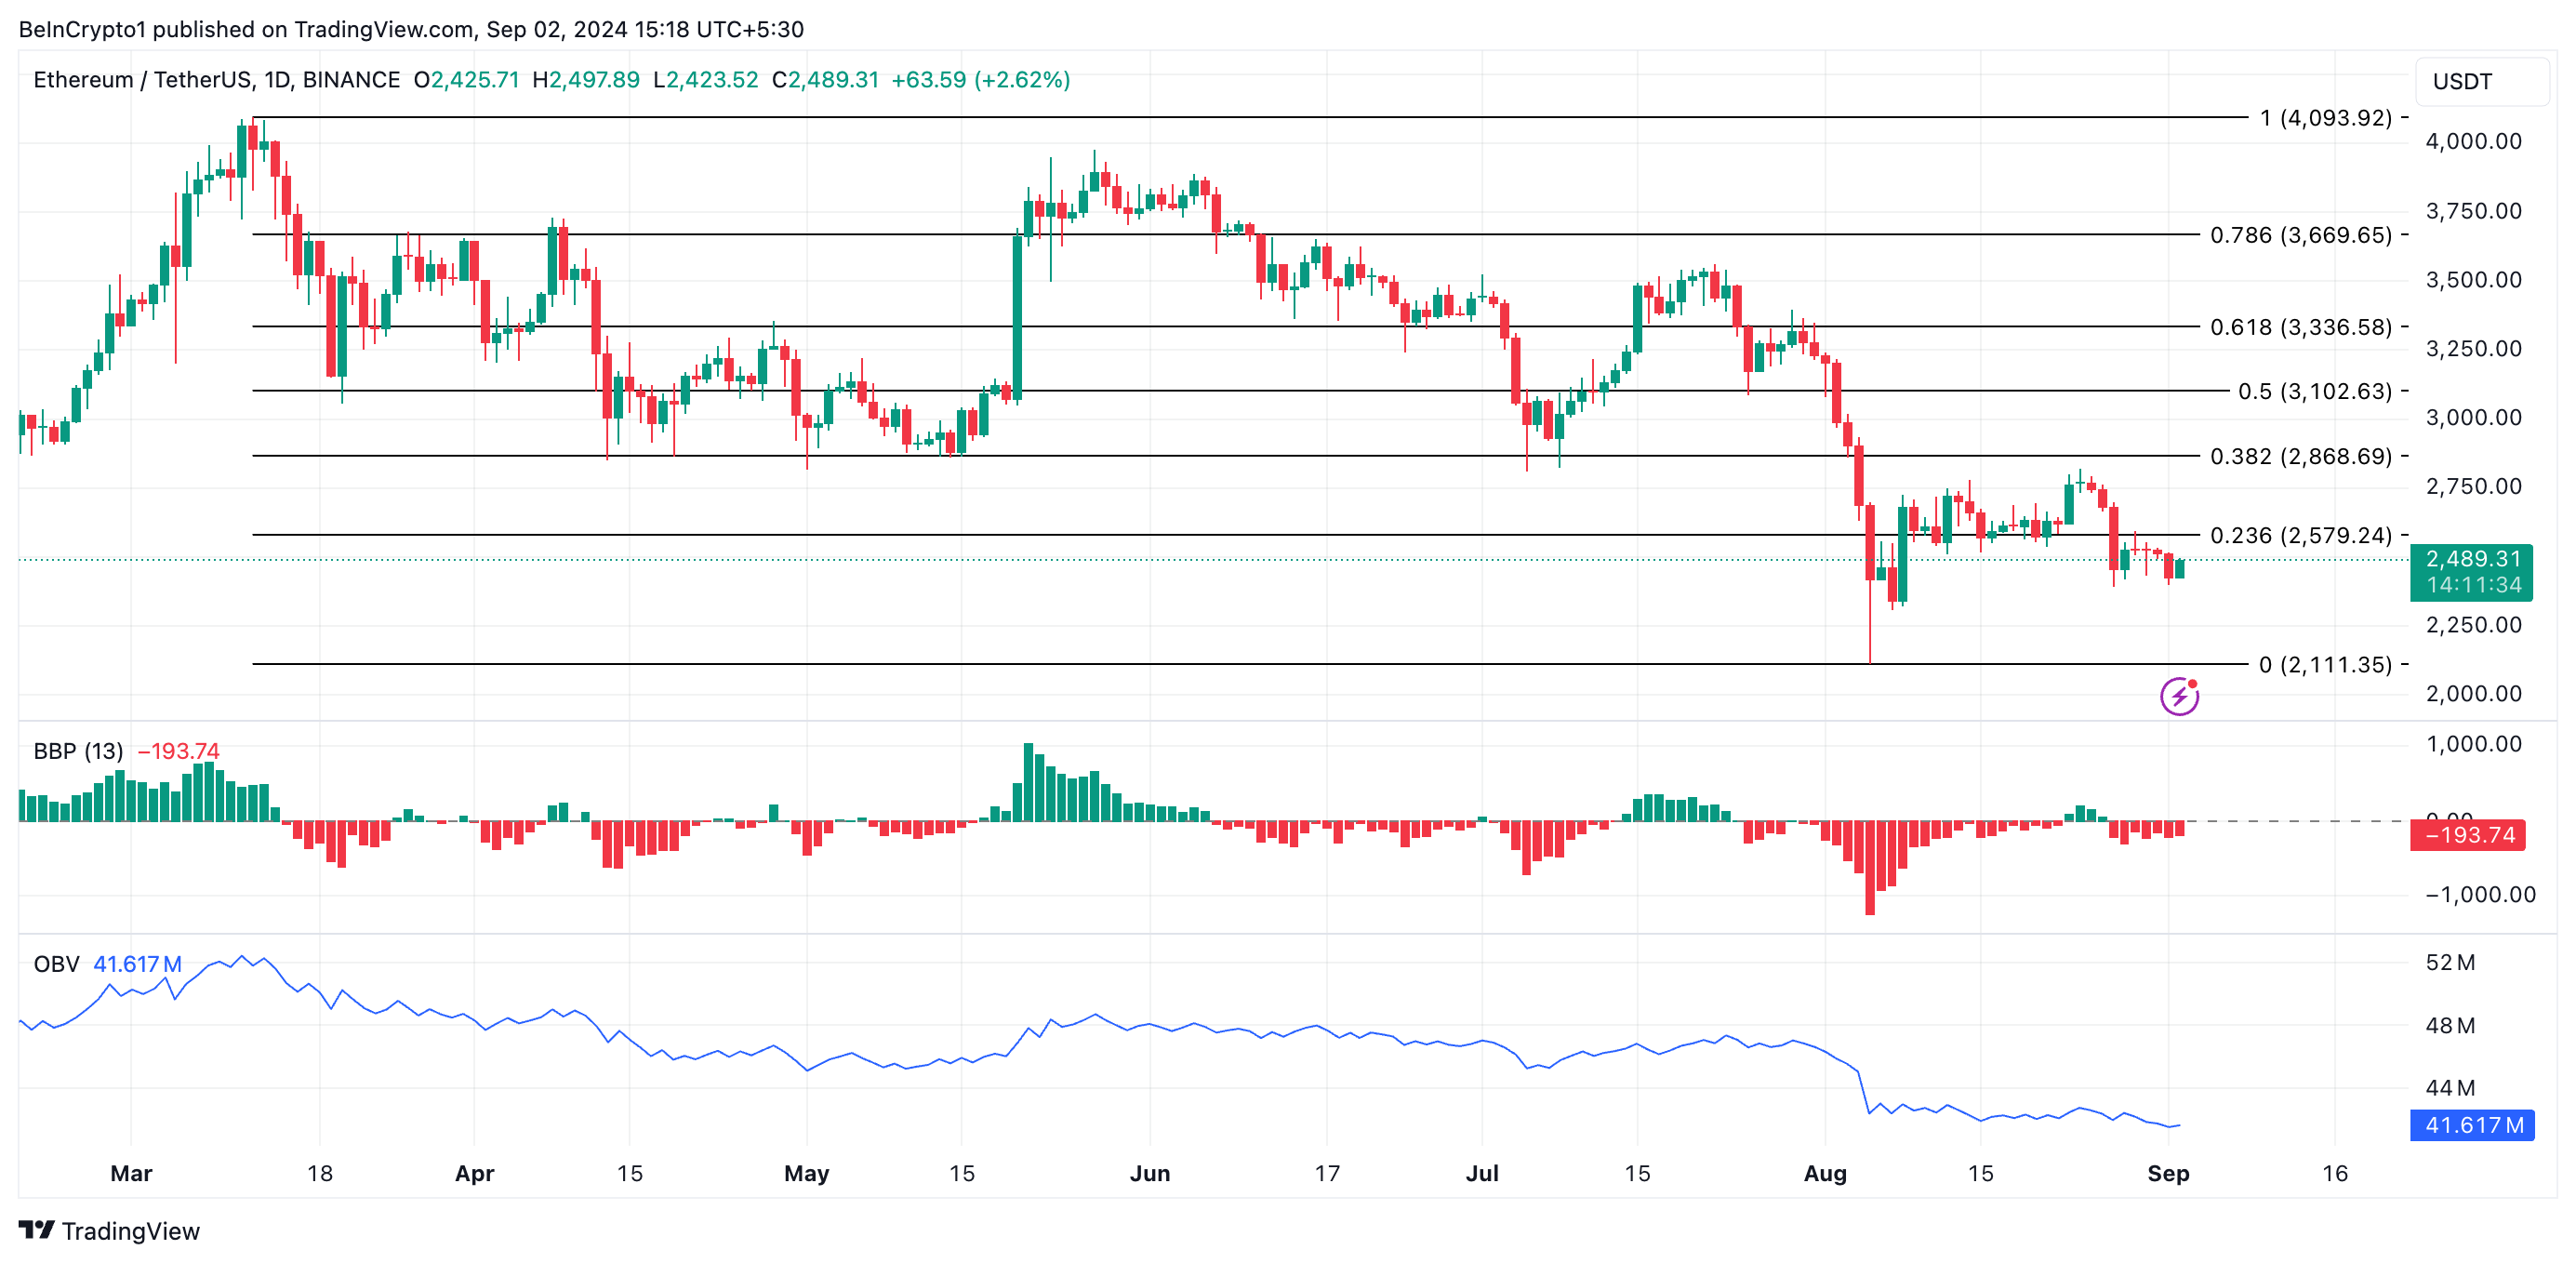
Over the past month, ETH’s value has dropped by 22%, with buying interest fading and signaling a continued downtrend. The one-day chart shows technical indicators supporting this bearish outlook. For instance, the Elder-Ray Index returns a negative value of -207.82.
This indicator measures the relationship between the strength of buyers and sellers in the market. When its value is below zero, bear power dominates the market.
Additionally, ETH’s On-Balance Volume (OBV) has been declining since July 31, reflecting increasing selling pressure. As of now, ETH’s OBV stands at 41.60 million.
Read more: Ethereum (ETH) Price Prediction 2024/2025/2030

If this selling pressure continues to strengthen, ETH’s price could fall by another 14%, potentially dropping to $2,111. On the other hand, if the leading altcoin witnesses a resurgence in new demand, this may drive its price up toward $2,579.
Trusted
Disclaimer
In line with the Trust Project guidelines, this price analysis article is for informational purposes only and should not be considered financial or investment advice. BeInCrypto is committed to accurate, unbiased reporting, but market conditions are subject to change without notice. Always conduct your own research and consult with a professional before making any financial decisions. Please note that our Terms and Conditions, Privacy Policy, and Disclaimers have been updated.