Ethereum repeats 2021 pattern – What this means for ETH
09/19/2024 05:00
Ethereum [ETH] is poised for a significant breakout as traders spot a triple bottom pattern forming in 2024, reminiscent of its 2021 rally

- The triple bottom pattern suggested a potential breakout as ETH eyed the $3,500 resistance.
- Exchange outflows and RSI levels pointed to a possible bullish move, but network growth remained flat.
Ethereum [ETH] is poised for a significant breakout as traders spotted a triple bottom pattern forming in 2024, reminiscent of its 2021 rally.
With ETH trading at $2,314, up 0.31% in the last 24 hours at press time, this setup has sparked optimism that Q4 could deliver substantial gains.
Can the triple bottom drive a bullish reversal?
The triple bottom is a well-known pattern, often indicating a bullish reversal. In 2021, Ethereum followed a similar structure before launching into a massive rally.
If Ethereum maintains this trajectory, a breakout above $3,500 can further fuel investor confidence.
To confirm bullish momentum, Ethereum must break through critical resistance levels. The $2,800 mark is the first major hurdle, and surpassing it could set the stage for a test of $3,500.
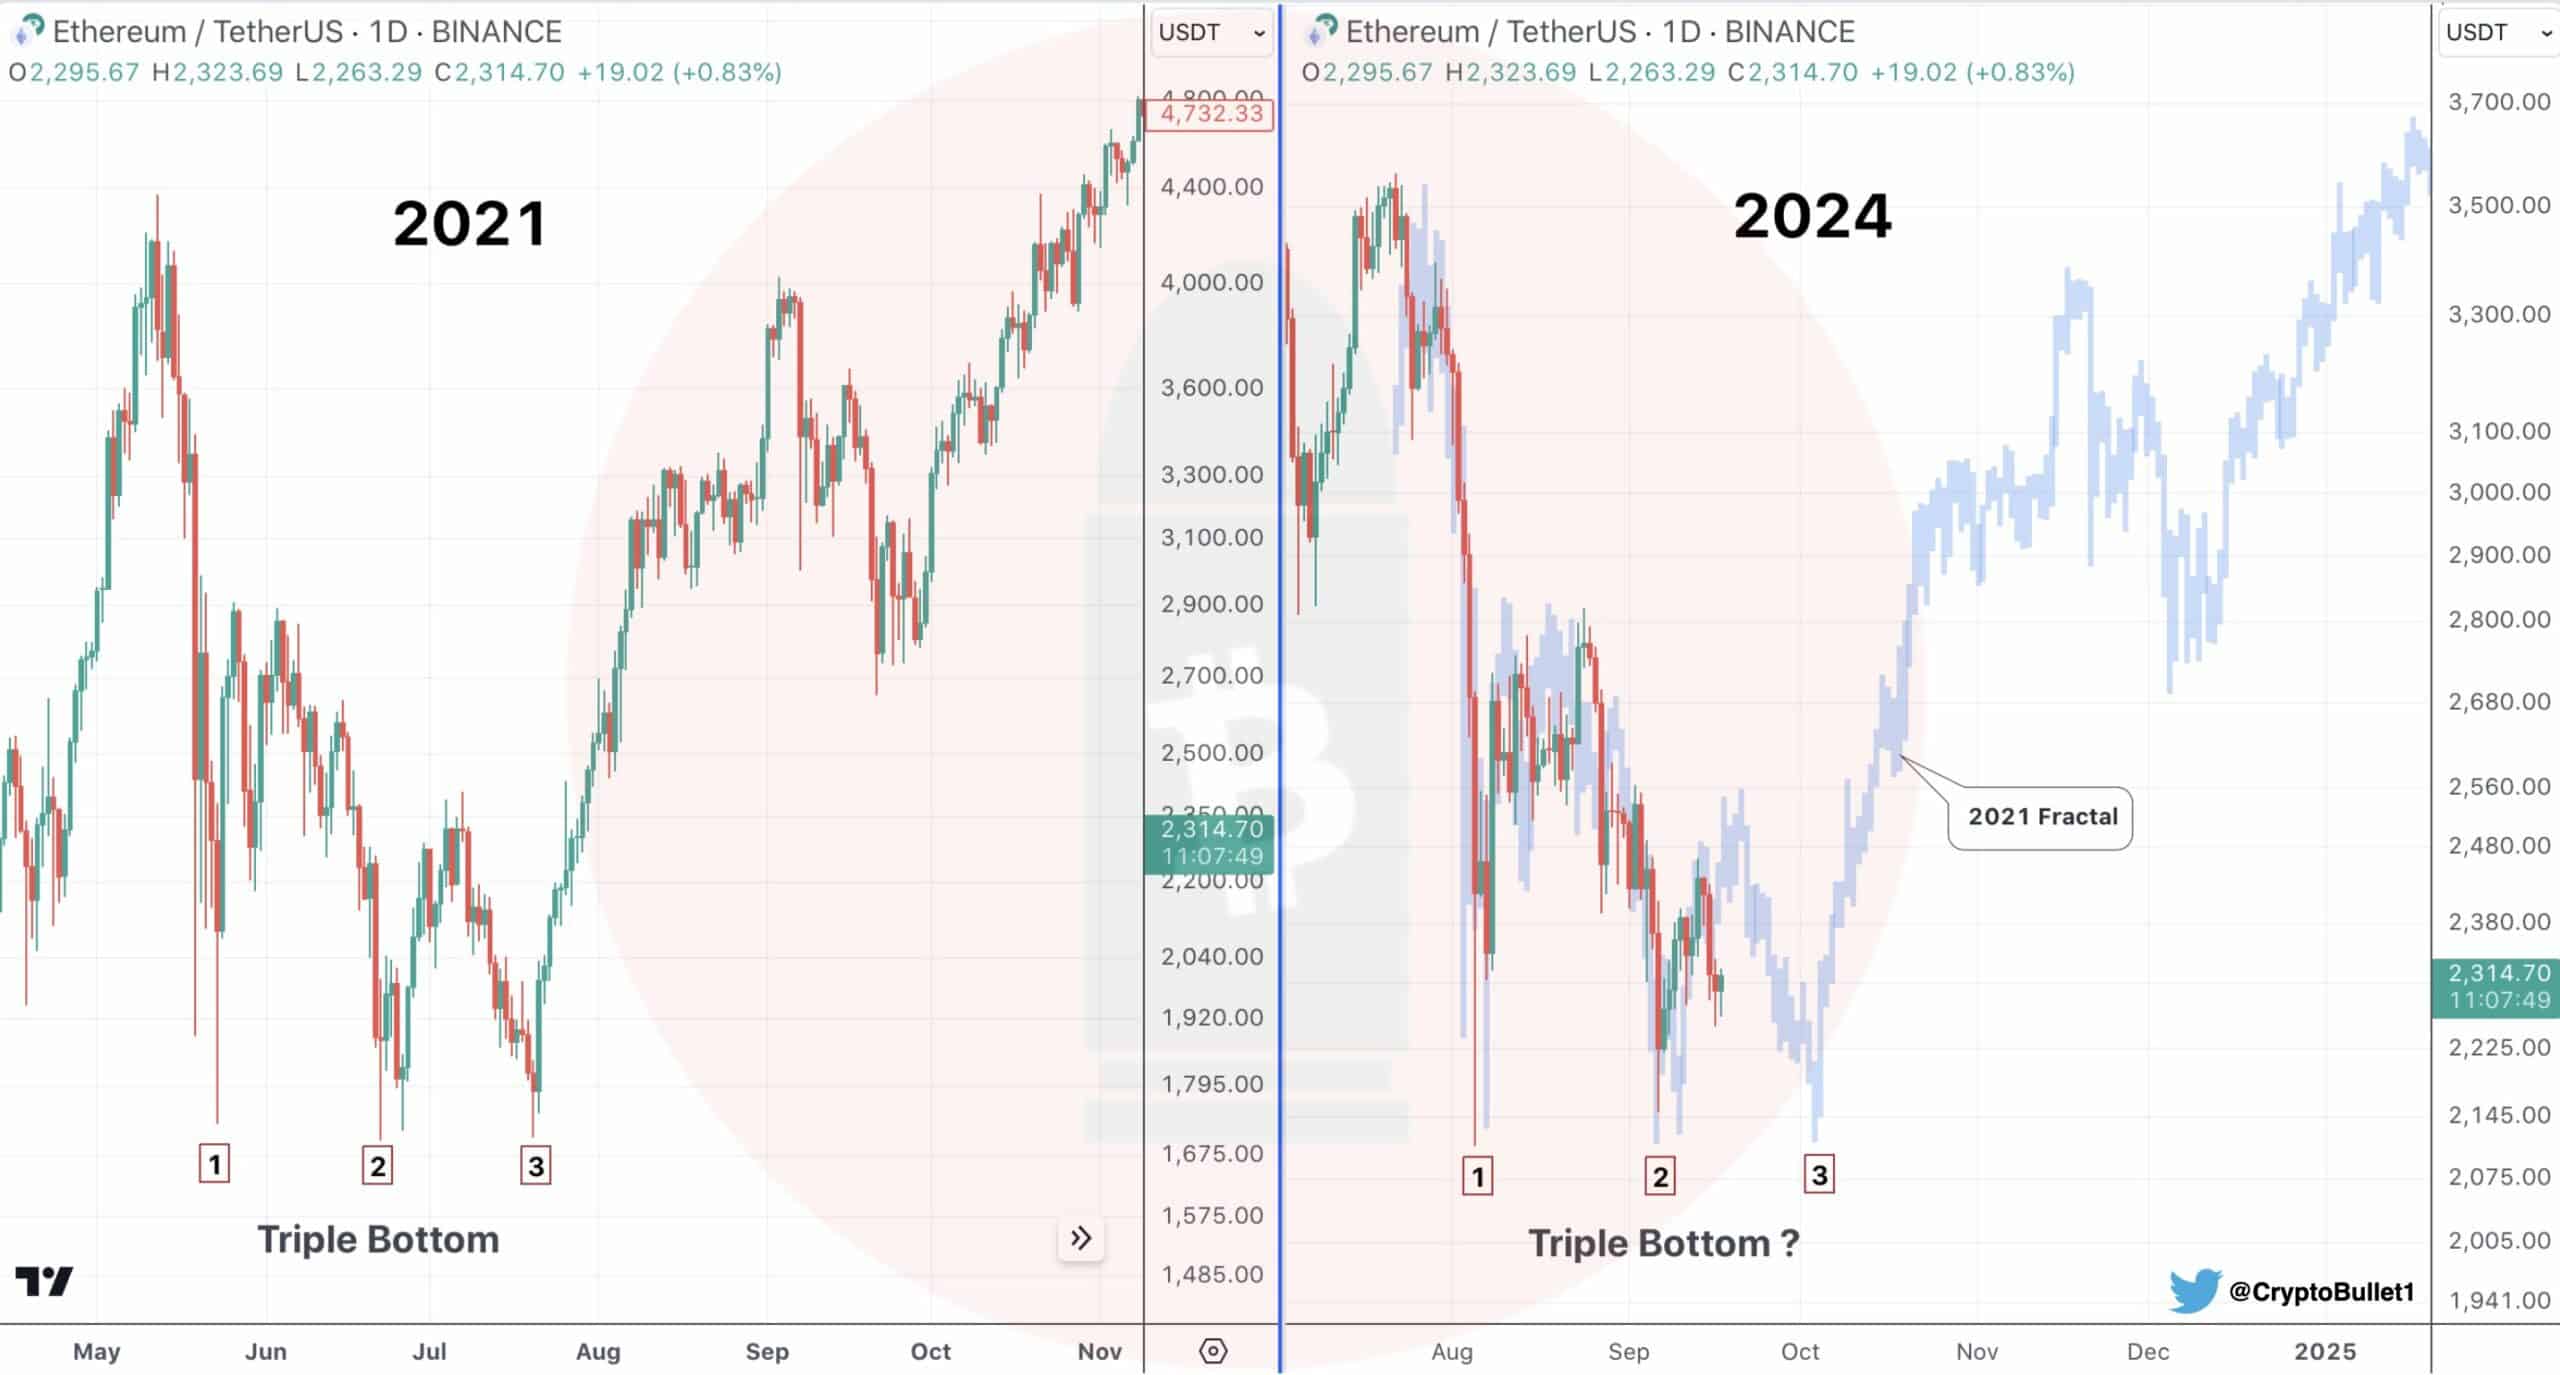
Source: X
What about ETH’s strength?
Technical indicators showed a promising outlook for Ethereum. The Relative Strength Index (RSI) was 45.63 at press time, signaling that ETH is neither overbought nor oversold.
The Bollinger Bands (BB) indicated that ETH was trading in a tight range, with potential volatility on the horizon.
A breakout above the upper band could trigger a strong rally, making these indicators crucial to watch in the coming days.
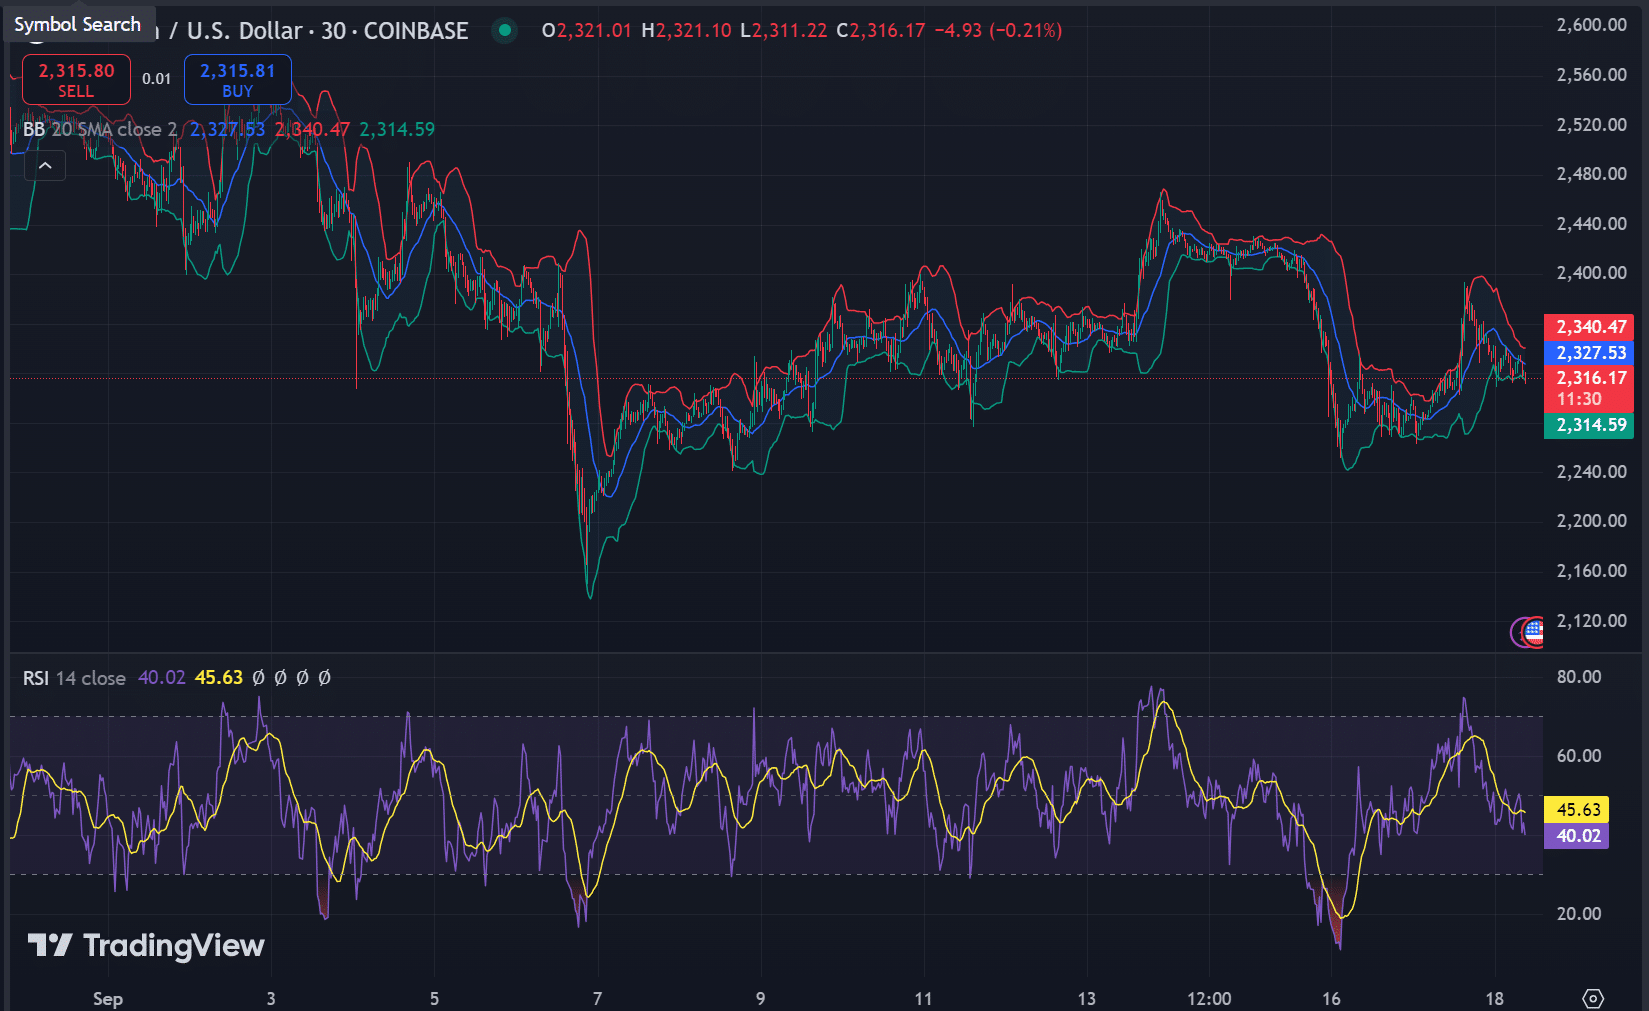
Source: TradingView
Are exchange flows pointing to a rally?
Exchange flow data showed mixed signals but lent toward a potential bullish move at press time.
Exchange inflows have increased by 0.82% in 24 hours, reaching 349.05K ETH at press time, signaling some selling pressure as traders move coins onto exchanges.
However, exchange outflows have risen by 0.77% in 24 hours to 328.83K ETH at press time, showing that many investors were still holding their coins off exchanges.
If outflows continued to rise, it could indicate reduced sell pressure and growing confidence in ETH’s upward potential.
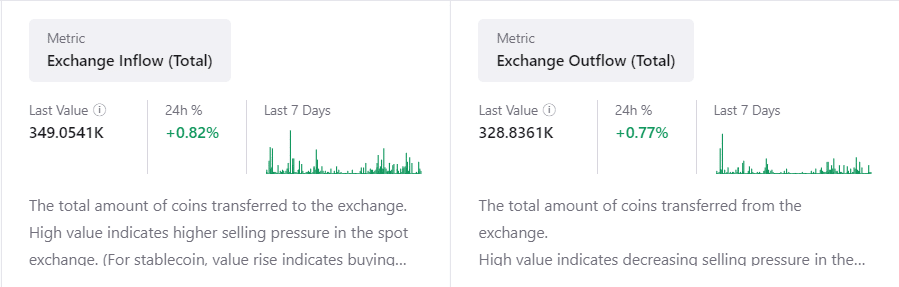
Source: CryptoQuant
Network growth: Is Ethereum expanding?
Ethereum’s network growth remained relatively slow, with 27,181 new addresses added recently and a 0.24% growth rate over the last 24 hours until press time.
The neutral signal suggested that while Ethereum’s network is stable, it is not seeing a surge in new user activity.
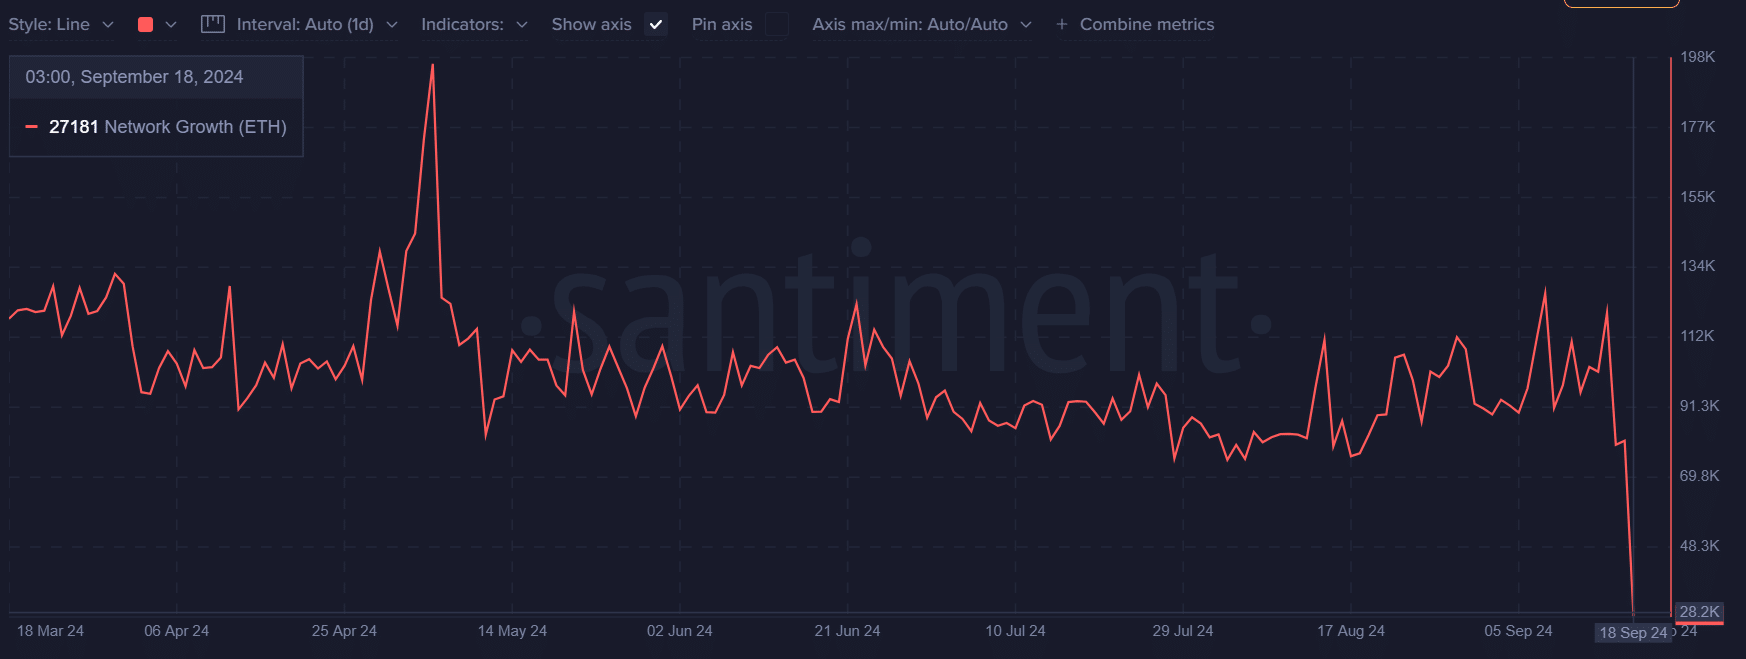
Source: Santiment
Read Ethereum’s [ETH] Price Prediction 2024–2025
Will Q4 deliver the breakout?
Ethereum stands at a pivotal moment. While technical patterns like the triple bottom, RSI, and Bollinger Bands indicate a potential breakout, the network growth and mixed exchange flows suggest some caution.
With volatility expected, Q4 will likely determine whether Ethereum can break through key resistance levels and recapture the bullish momentum that drove its 2021 rally.