Bitcoin – Bullish signal makes this prediction about BTC’s price rally!
09/29/2024 09:00
Over the last 30 days, Bitcoin [BTC] has seen a significant rebound on its price charts after 2 months of extreme volatility...
- BTC appreciated by 10.38% on the monthly charts
- Analysts are eyeing a further rally citing the historical relationship between MVRV and SMA 365
Over the last 30 days, Bitcoin [BTC] has seen a significant rebound on its price charts after 2 months of extreme volatility. In fact, since hitting a high of $70,016 in July, BTC has declined significantly, even falling to a local low of $49k.
However, since the Fed rate cuts a week ago, BTC has made notable gains. At the time of writing, Bitcoin was trading at $65,839. This marked a 10.38% hike on the monthly charts, with an extension to the bullish trend by a 4.47% hike in 24 hours.
Will the king coin continue its rally?
This recent surge has caught the attention of the crypto community, leaving analysts talking. One of them is Cryptoquant analyst Burak Kesmeci, who suggested that a long-term rally might sustain itself, citing the MVRV metric.
Source: Cryptoquant
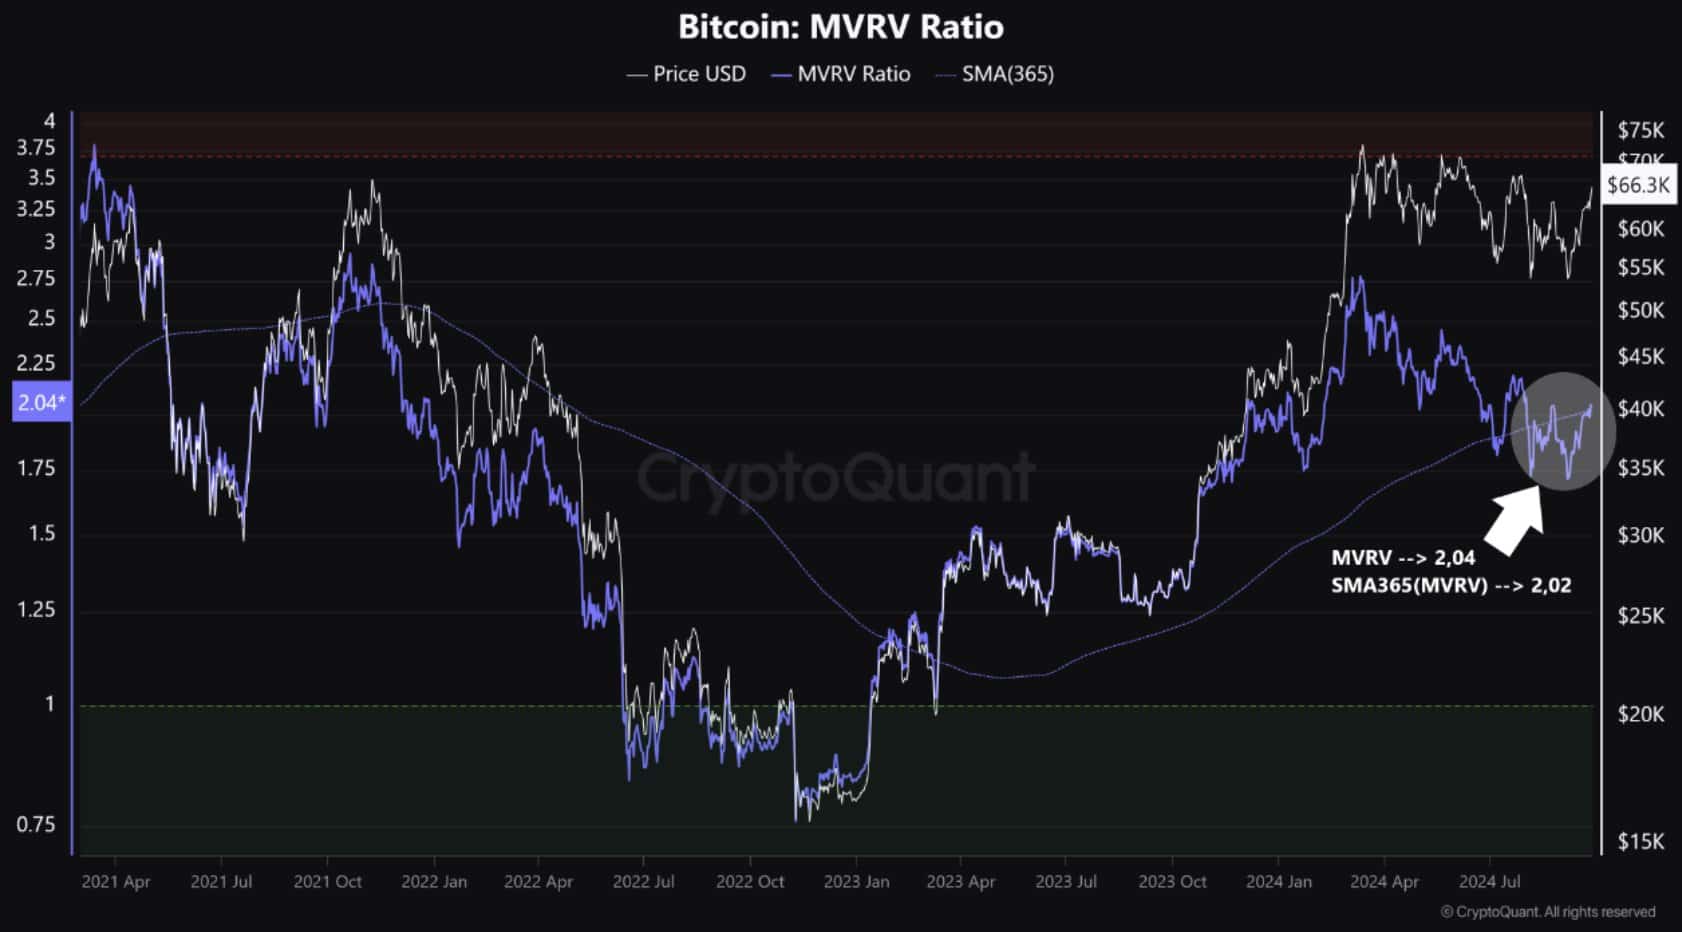
According to Kesmeci, the Bitcoin MVRV Metric is now flashing a bullish signal again, with the MVRV pricing above its SMA 365. After analyzing the historical relationship between the MVRV and the 365-day moving average, the analyst determined that BTC usually records a rally after the MVRV rises above SMA365.
At press time, the MVRV was at 2.04, sitting above its SMA 365 at 2.02. Thus, the analyst interpreted this as a strong bullish signal, positing that bulls have the market to lose.
When the MVRV and SMA 365 are set like this, it means that the long-term trend is strengthening. Especially as BTC’s current market value is higher than its average realized value over the past year. This upward movement is a sign of growing confidence among long-term holders and investors.
Therefore, based on this observation, Bitcoin may be seeing higher demand, something that might be driving prices up.
What do the charts say?
While the metric highlighted by Kesmeci provided a positive outlook, the question is what do other fundamentals say?
Source: Cryptoquant
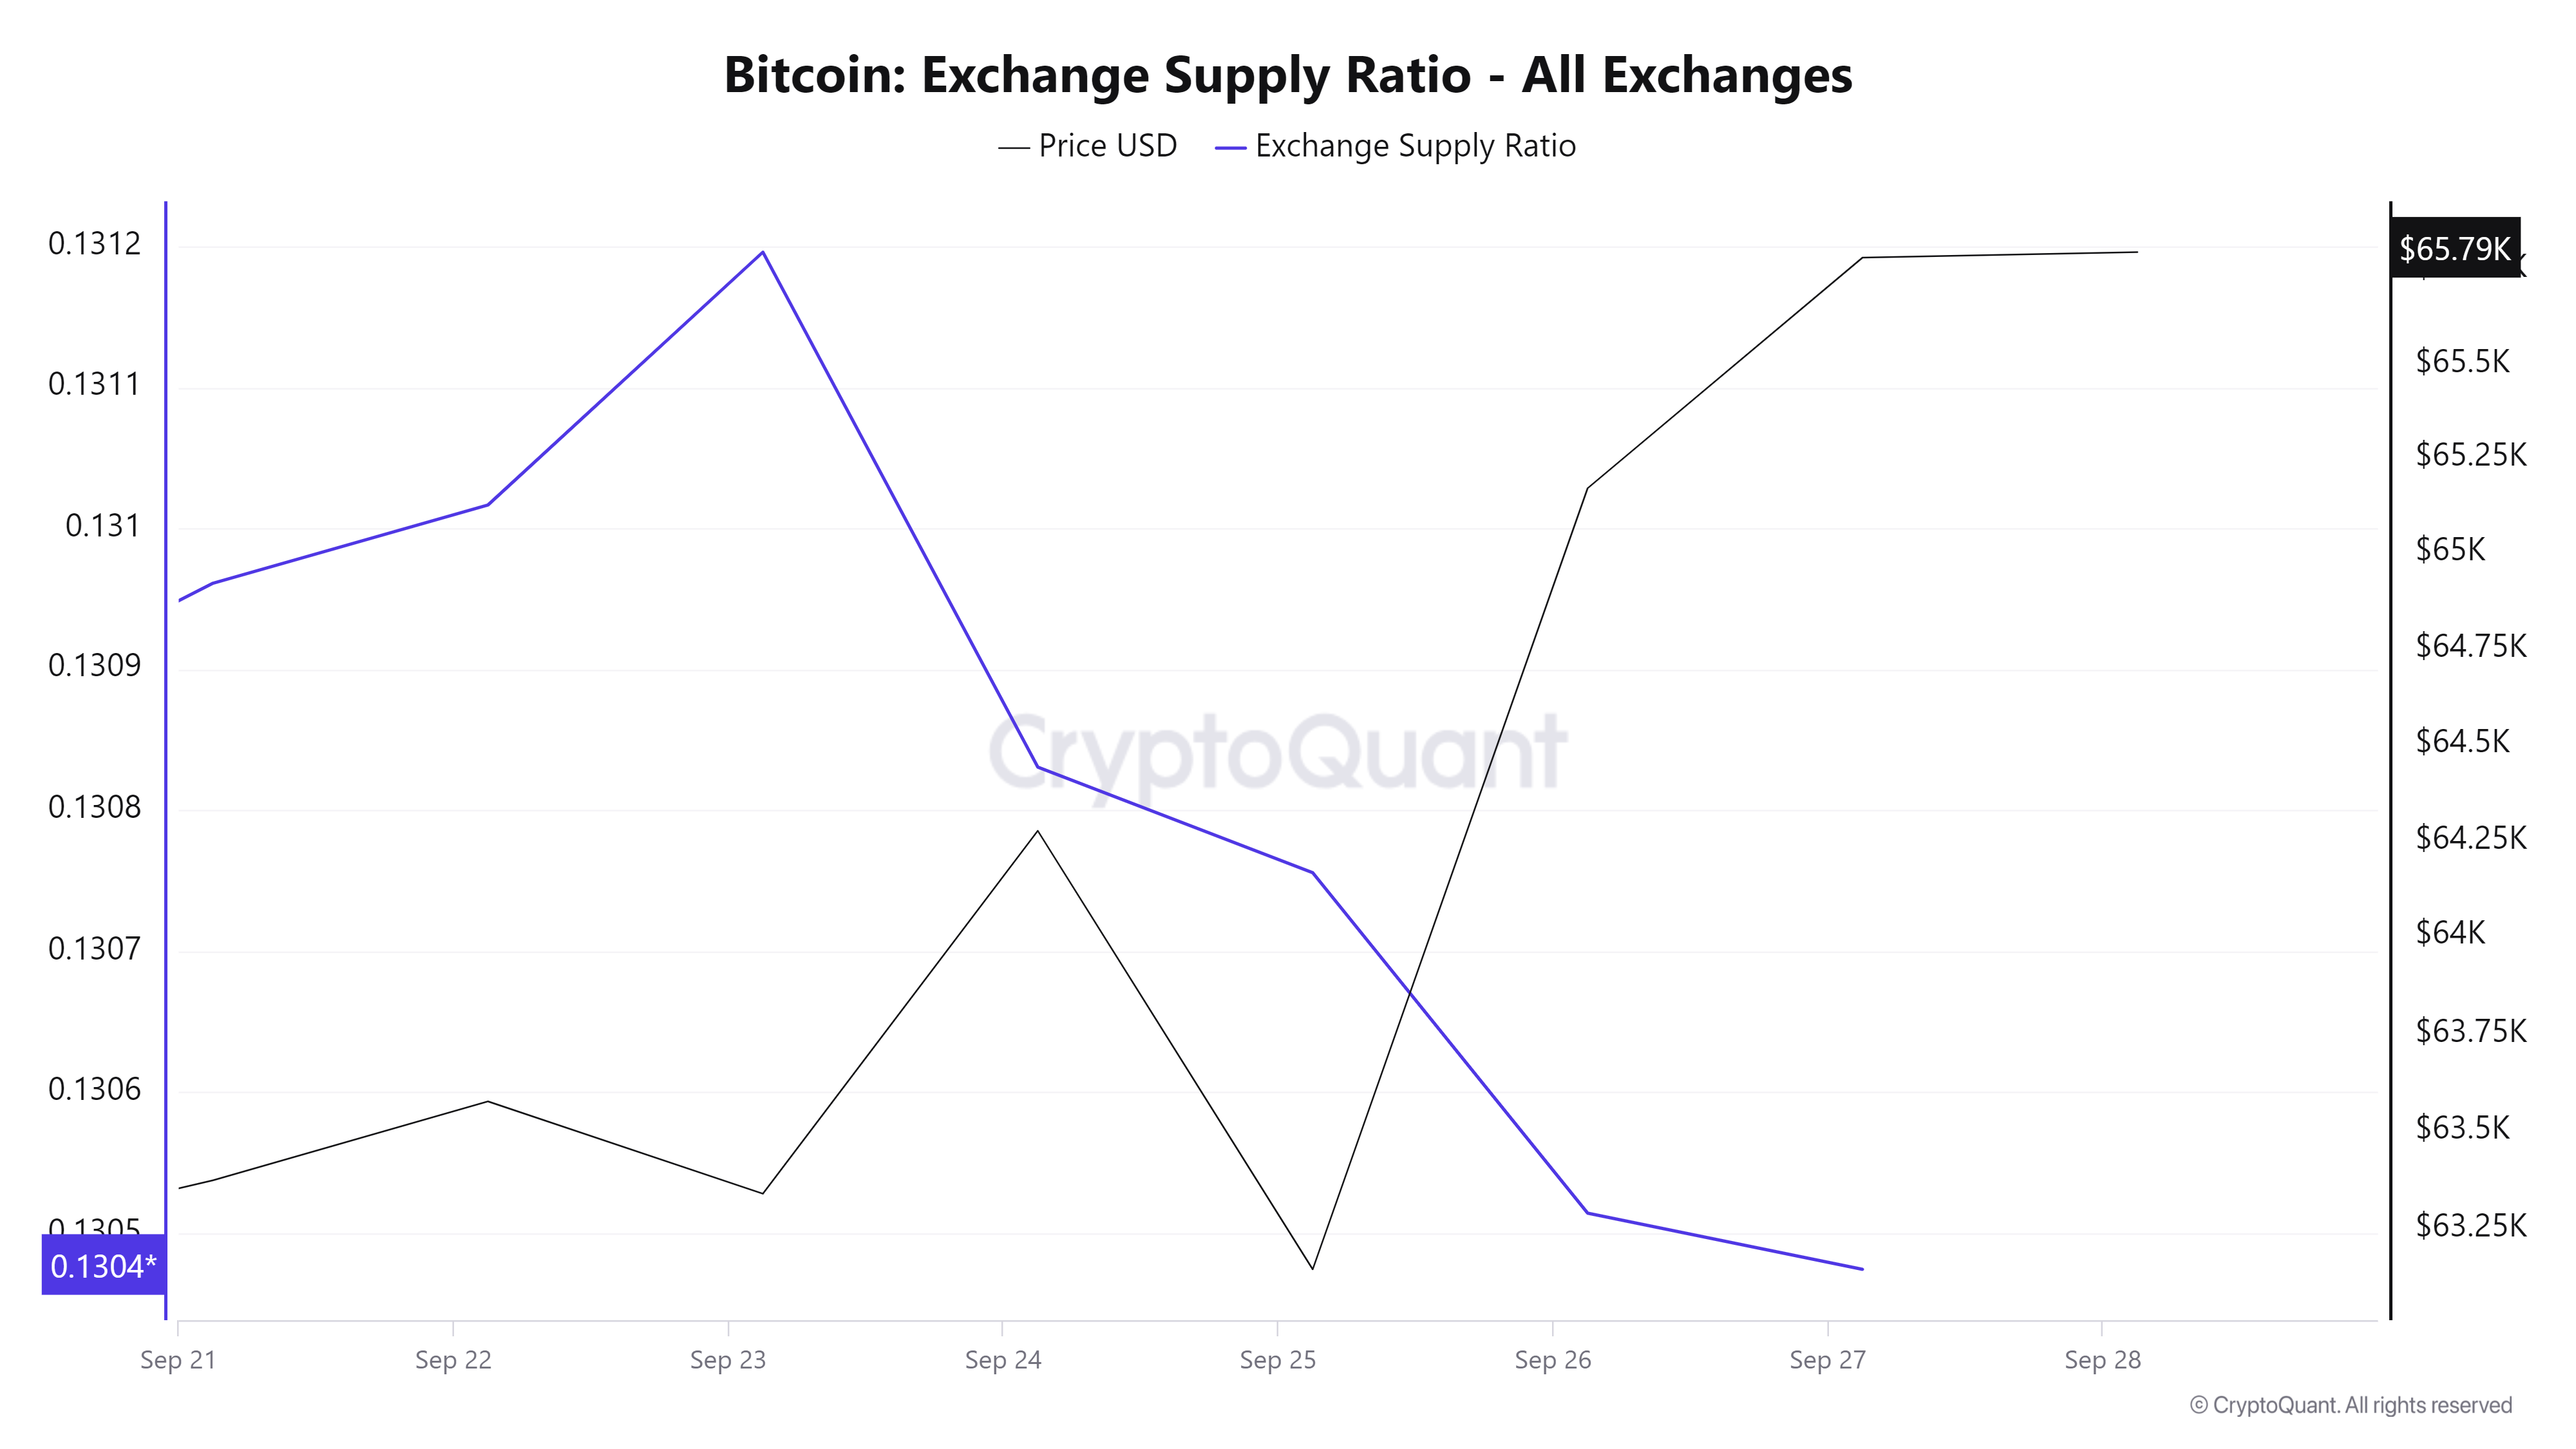
For starters, Bitcoin’s Exchange Supply ratio registered a sustained decline over the past week. Over this period, the exchange supply ratio declined from 0.1311 to 0.1304.
This decline reflects investors’ holding behavior as they hold their assets in cold wallets, rather than on exchanges. This is a bullish signal, one which implies investors’ confidence in the future values as long-term holders expect the crypto’s price to rise.
Source: Cryptoquant
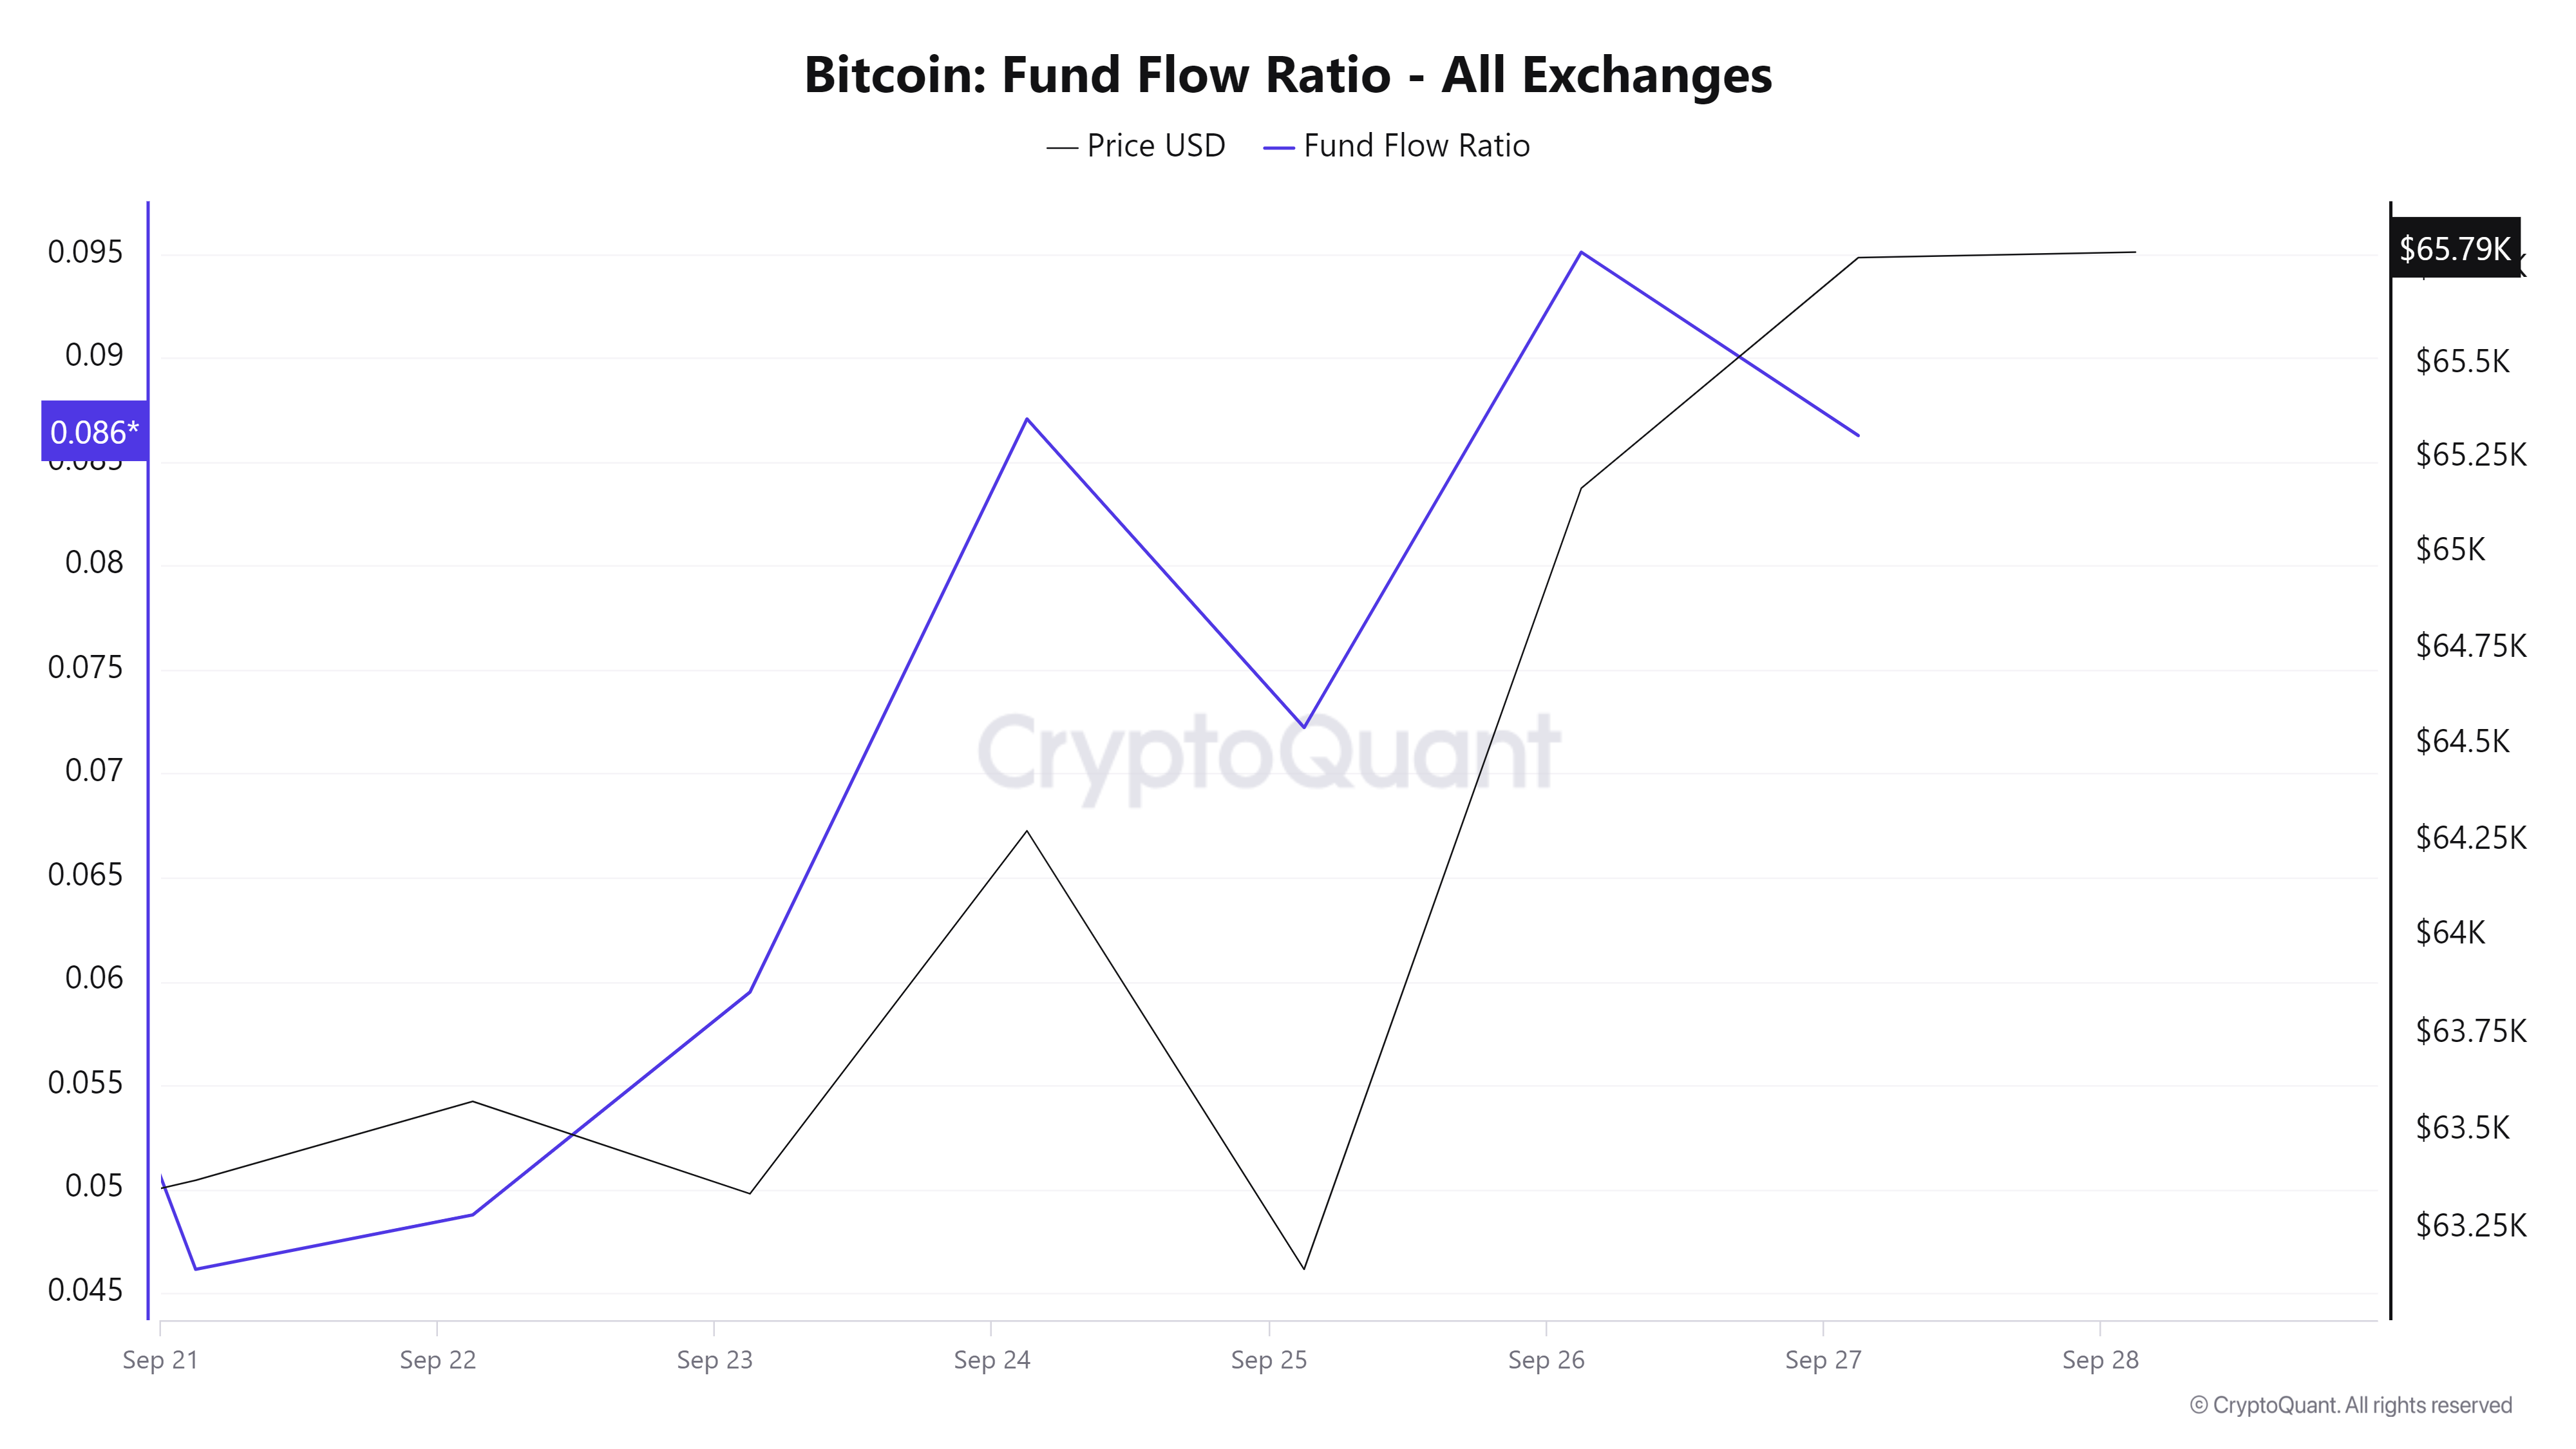
Additionally, Bitcoin’s fund flow ratio has been on an uptrend over the past week. FFR increased from 0.04 to 0.086 over the last 7 days.
This is a sign of greater funds inflows into BTC. By extension, this reflects growing confidence among investors. Under this market condition, investors are more likely to buy BTC anticipating future gains.
Source: Cryptoquant
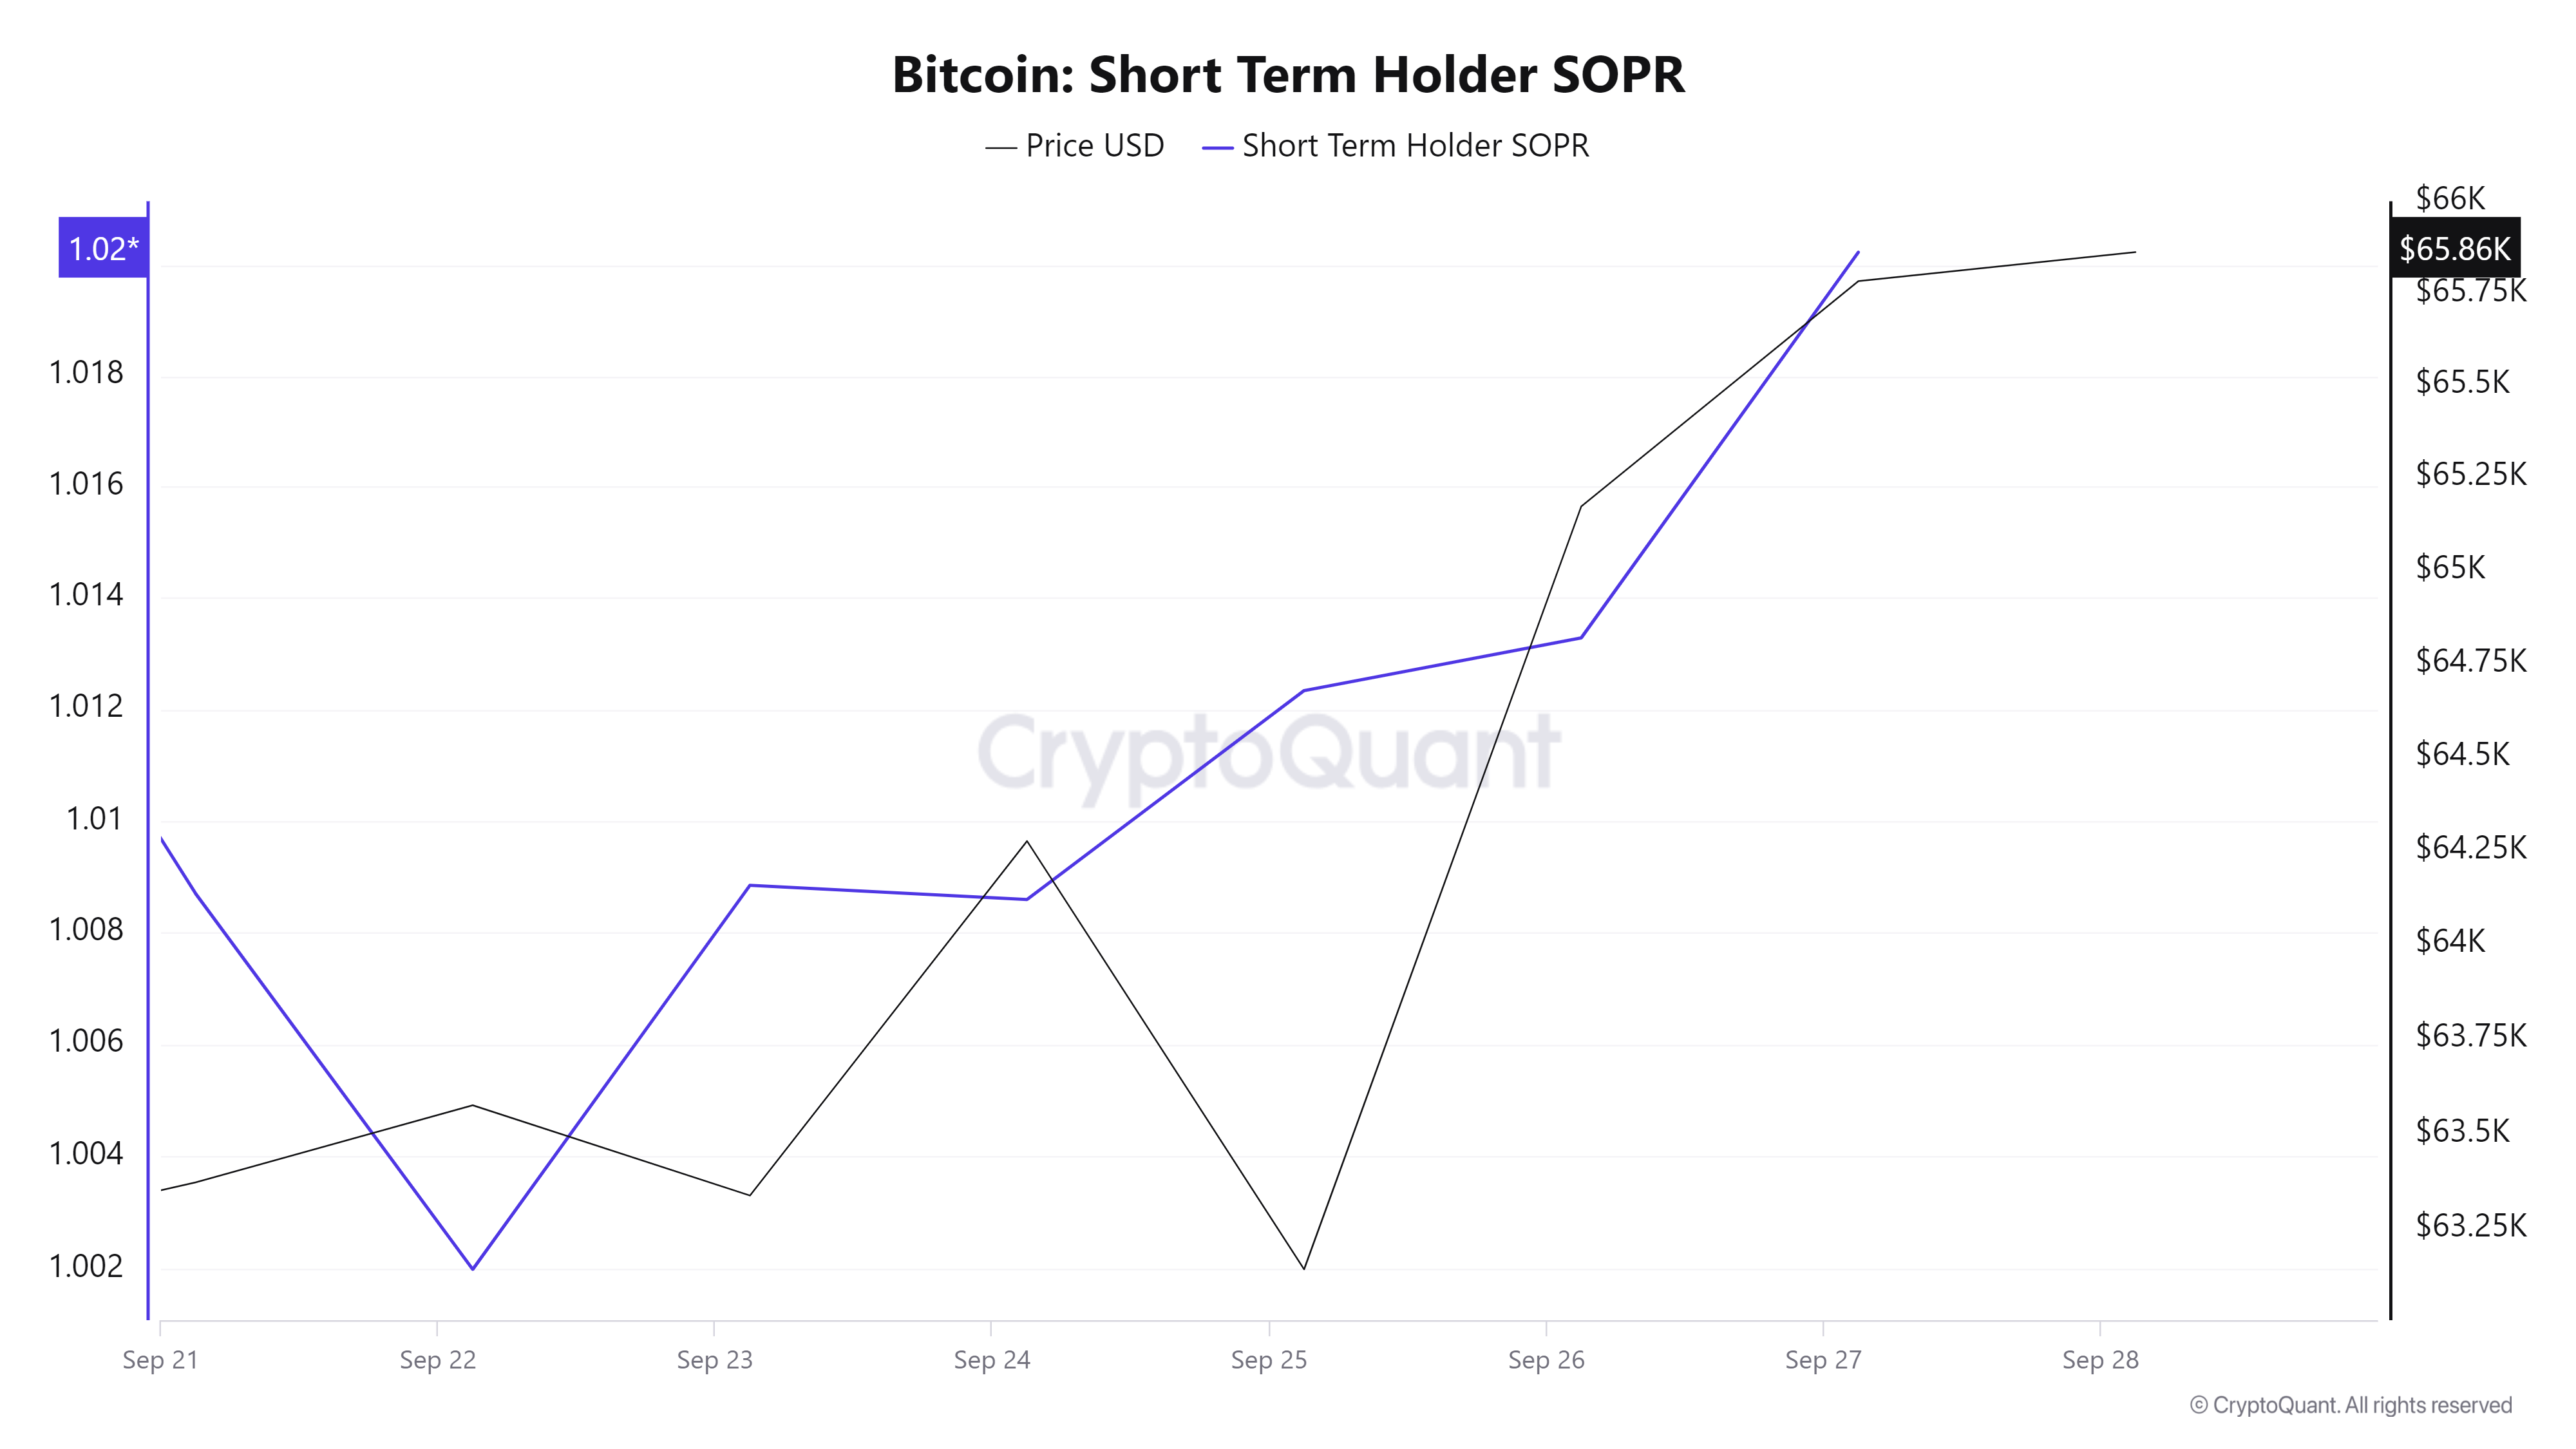
Finally, Bitcoin’s Short-term holder SOPR has also been rising over the past week. A rising short-term SOPR during an uptrend shows that the market is strong. Thus, although the short-term holder is selling at a profit, the demand is also high enough to absorb the selling pressure without resulting in a decline. This means the uptrend is likely to continue.
Simply put, BTC is experiencing a positive market sentiment and hiking investor favourability. If these market conditions hold, BTC will attempt to breach the $68,240 resistance level.