Helium (HNT) Price Shows Growth Potential Amid Reversal Risks
10/02/2024 01:30
Helium's (HNT) price rise faces a weak ADX trend. With RSI neutral, the uptrend could continue or reverse to $6.30.
Helium (HNT) price has been on the rise despite the broader market downturn. What could be behind this? Although HNT is currently in an uptrend, several indicators suggest the strength of this trend may not be as solid as it seems.
The ADX reveals a weakening trend, and while the RSI indicates there could be room for further growth, the low momentum raises questions about whether the uptrend can sustain itself.
HNT ADX Shows The Current Trend Isn’t Strong
HNT’s ADX has dropped significantly to 13.28, down from a strong reading of 40 on September 18, signaling a major weakening in the strength of the current trend.
The ADX (Average Directional Index) is a technical indicator that helps determine the strength of a trend, regardless of its direction. When the ADX is above 25, it generally indicates that the trend is strong and likely to continue. Values below 20 suggest a weak or non-existent trend.
Read more: Helium (HNT) Price Prediction 2024/2025/2030
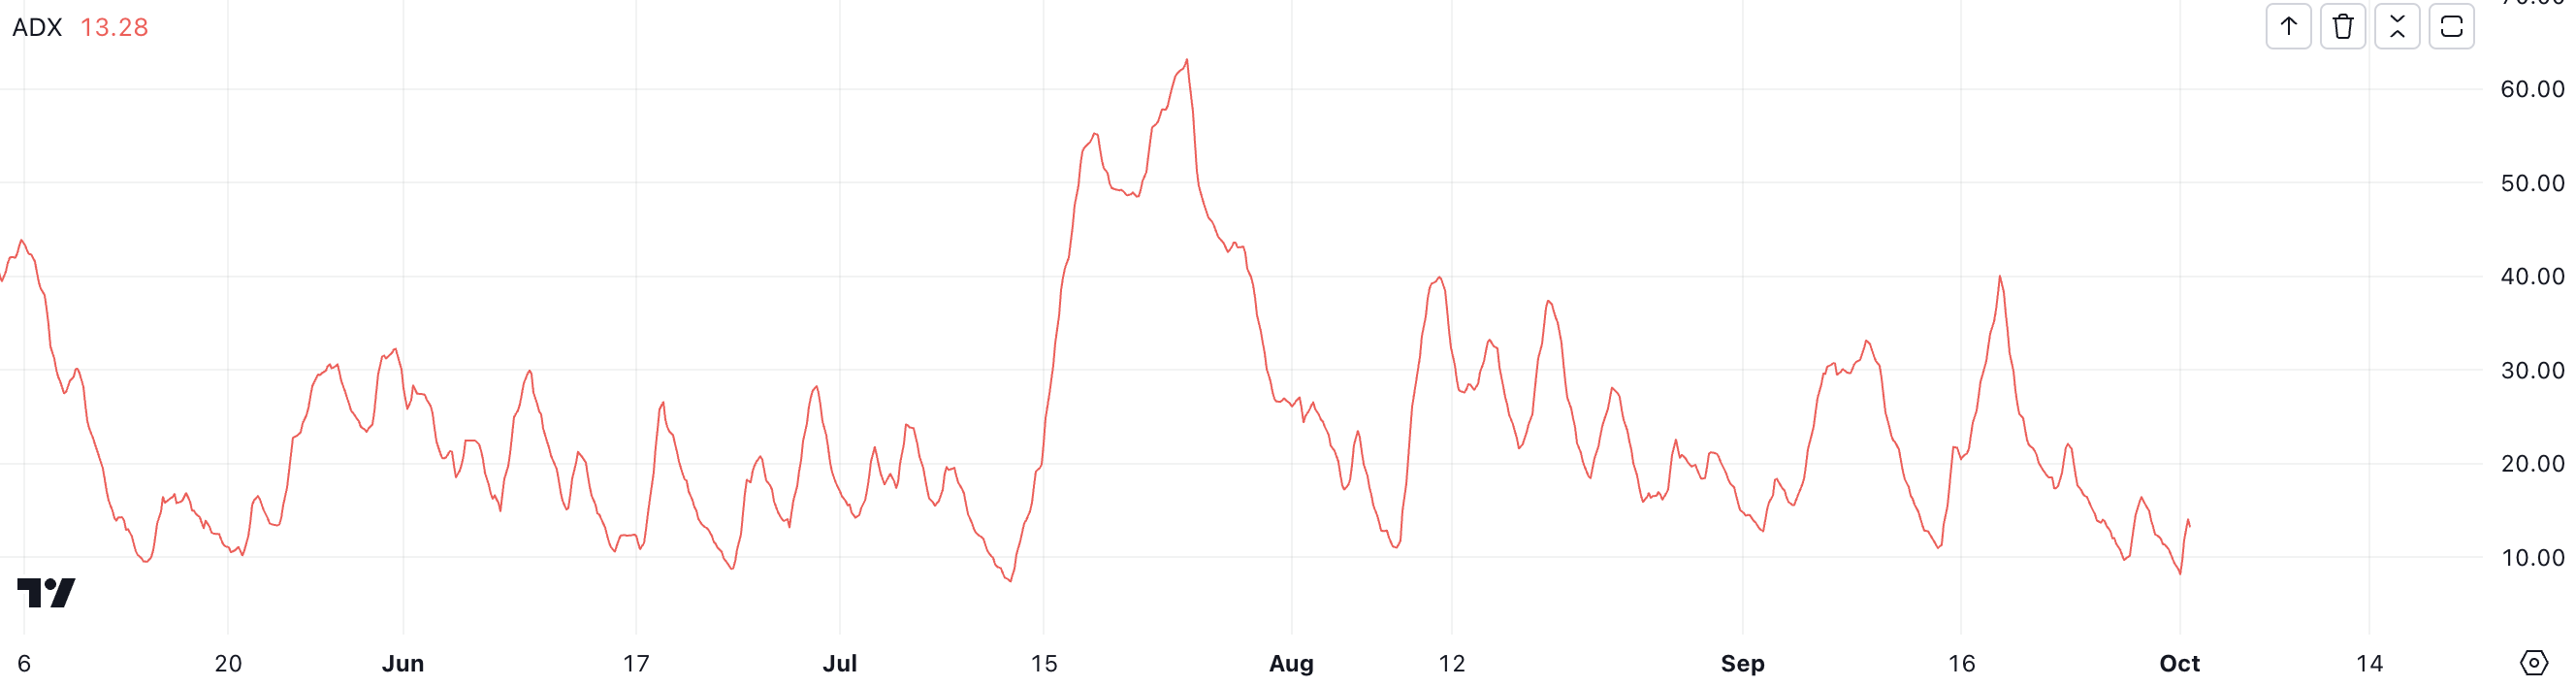
With HNT’s ADX now well below the 20 threshold, this points to a lack of momentum behind the current price movement. Even though HNT is still in an uptrend, the low ADX suggests that the trend lacks the necessary strength to sustain itself.
This weakness could result in the trend reversing in the near future as it becomes more susceptible to selling pressure or a shift in market sentiment. A declining ADX in this range indicates that traders should be cautious, as the uptrend may not last much longer if momentum continues to fade.
Helium RSI Shows A Price Increase Potential
HNT’s RSI is currently at 50.21, which reflects a neutral stance in terms of market momentum. That indicates that the price is neither overbought nor oversold. The RSI (Relative Strength Index) is a technical indicator that helps traders gauge the speed and change of price movements by measuring the magnitude of recent gains against recent losses.
It oscillates between 0 and 100, with readings above 70 suggesting overbought conditions — where a price correction might be imminent. On the other hand, readings below 30 indicate oversold conditions — where a rebound may be expected.
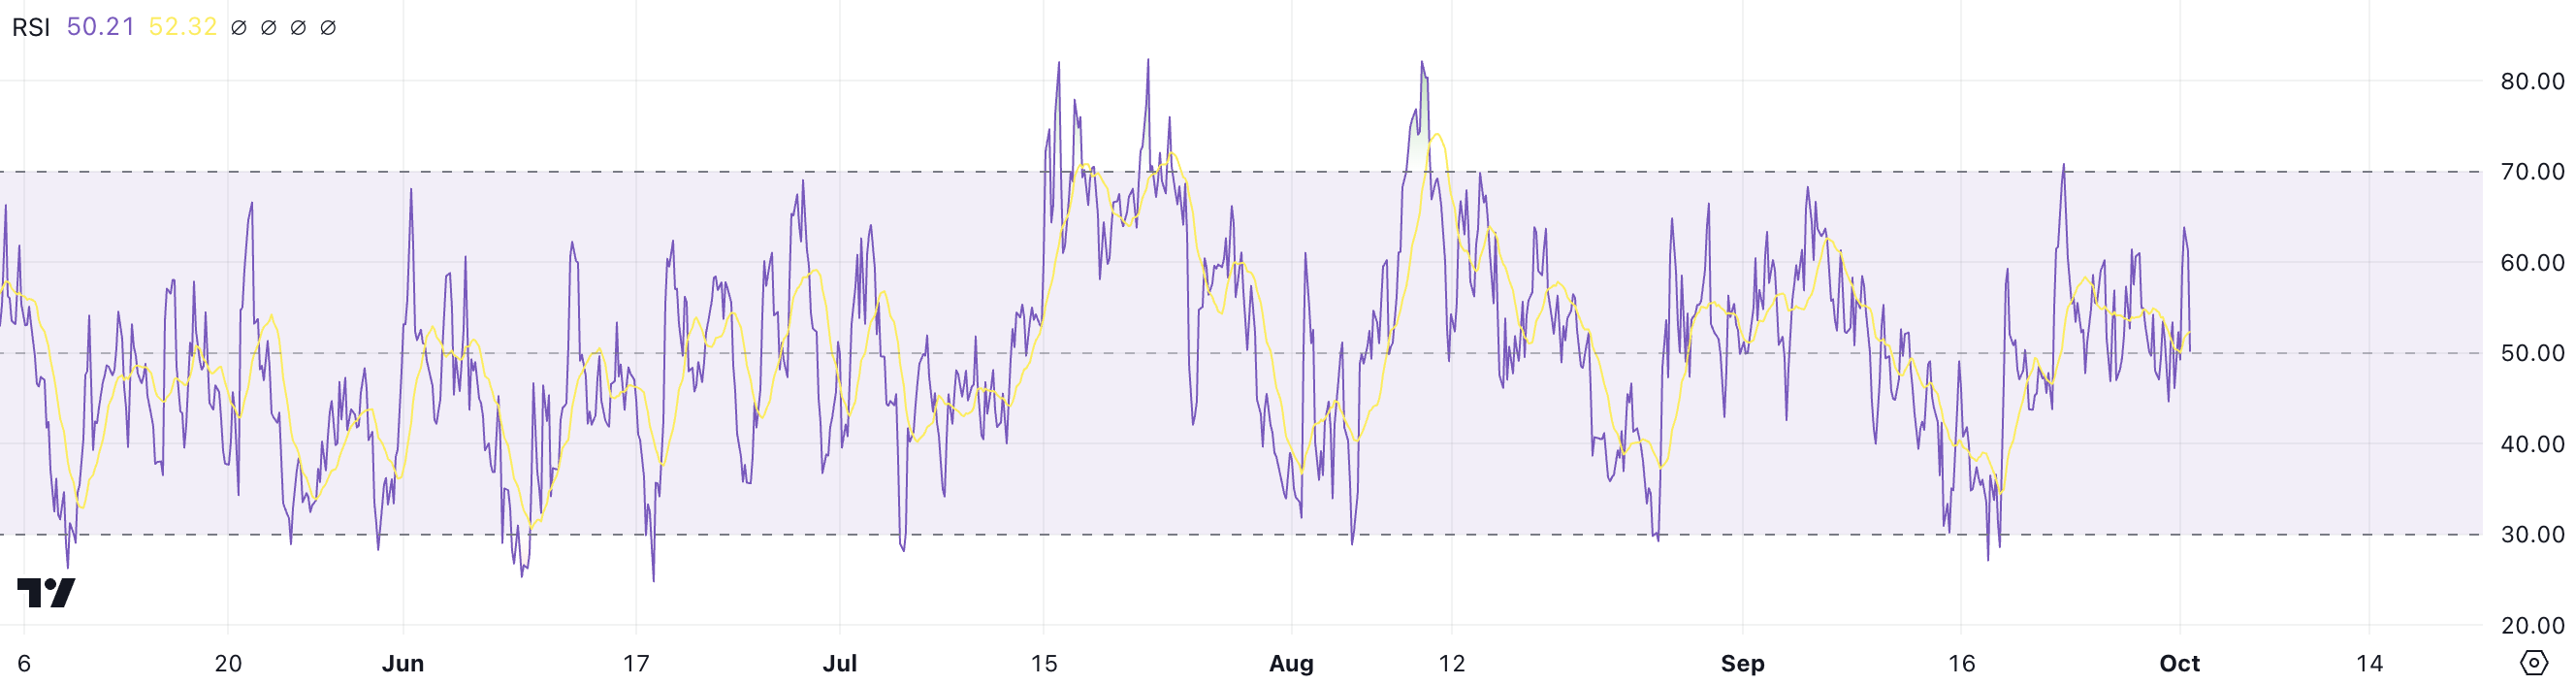
With HNT’s RSI at just over 50, the token finds itself in a balanced zone, meaning there isn’t excessive pressure from either buyers or sellers at the moment. This positioning leaves the door open for further price growth. That happens because the RSI has not yet reached levels that would signal an overheated market.
Given that HNT has already shown an upward trend with a 3.05% gain over the last 7 days, the biggest winner among the biggest DePin coins, the current RSI suggests that there could still be room for additional price appreciation.
On the other hand, ADX shows that the current trend is not strong enough. The balance between these two should is fundamental to track the next steps for HNT price.
HNT Price Prediction: Key Resistance at $8
HNT’s EMA lines are currently positioned in a bullish formation, having formed a golden cross on September 23. This golden cross occurs when a short-term EMA crosses above a long-term EMA. That signals the potential for a sustained upward trend.
However, despite this positive formation, the distance between the EMA lines remains relatively narrow. That suggests that the trend isn’t fully established or strong yet.
The Exponential Moving Average (EMA) is a technical indicator that tracks the average price of an asset over time but gives more weight to recent price movements. That makes it more responsive to price fluctuations than a simple moving average.
Read more: What Is DePIN (Decentralized Physical Infrastructure Networks)?
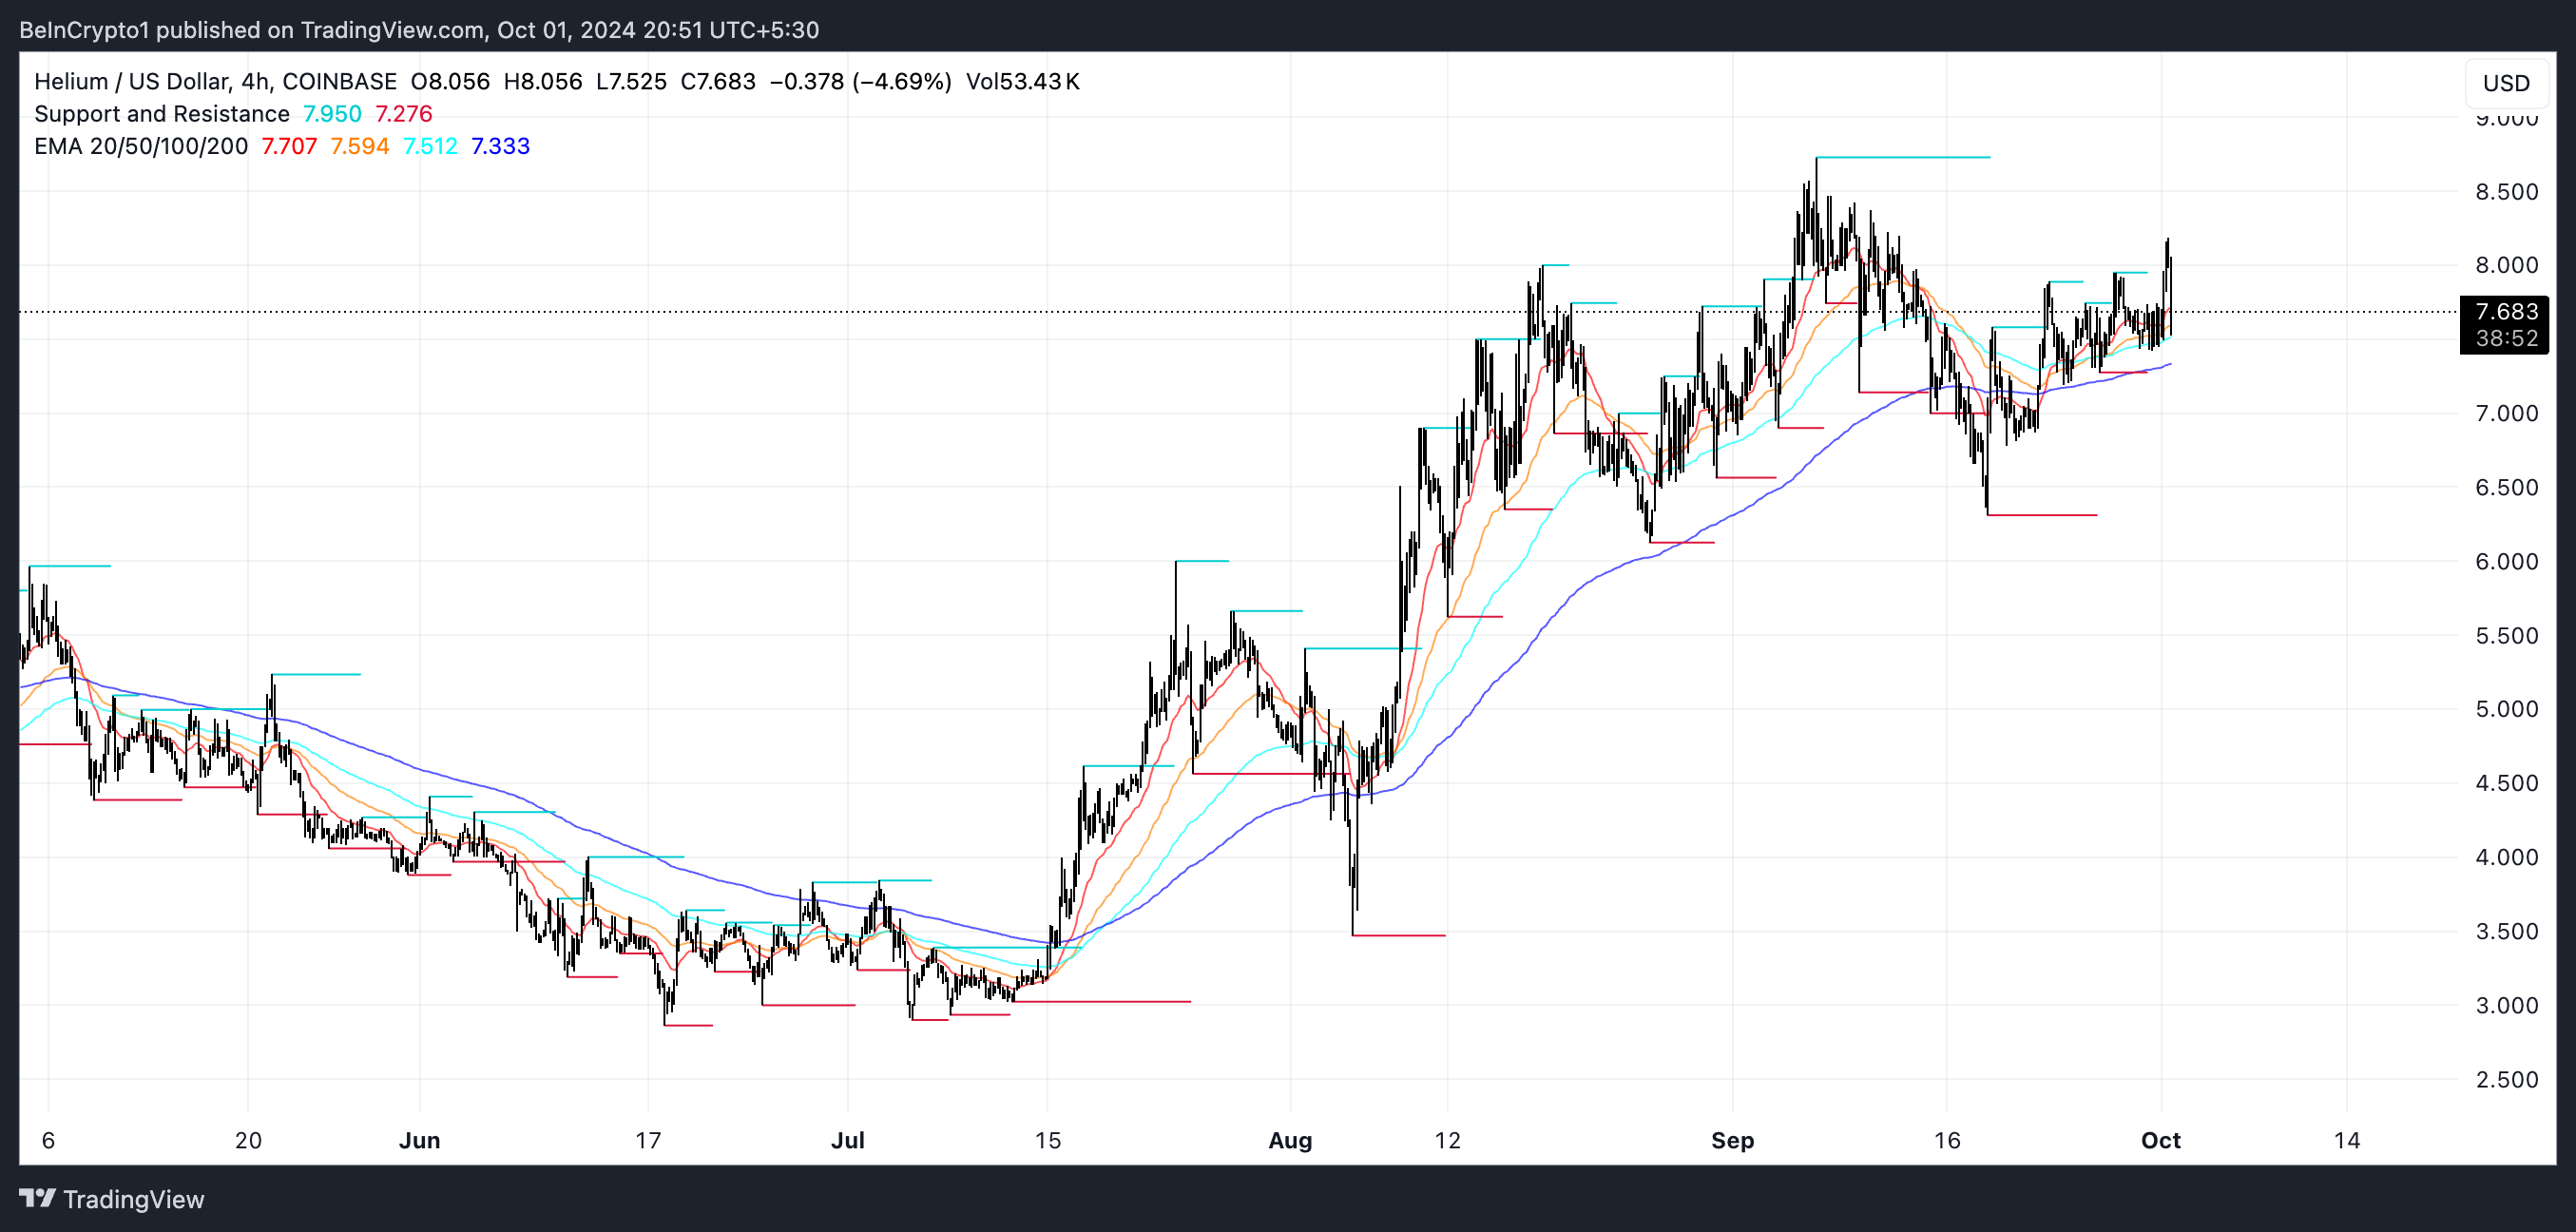
While the current EMA setup points to bullish potential, HNT has been facing resistance at the $8.00 level, struggling to break through this key barrier. If it manages to clear this resistance, it could rise to $8.70, offering a potential 10% gain.
However, with the ADX indicating a weak trend, there’s a real possibility that the momentum may fade. That means the uptrend could reverse. If this happens, HNT’s price could drop as low as $6.30, a substantial 20% decline.
Trusted
Disclaimer
In line with the Trust Project guidelines, this price analysis article is for informational purposes only and should not be considered financial or investment advice. BeInCrypto is committed to accurate, unbiased reporting, but market conditions are subject to change without notice. Always conduct your own research and consult with a professional before making any financial decisions. Please note that our Terms and Conditions, Privacy Policy, and Disclaimers have been updated.