Optimism set for a 70% surge? Key resistance to trigger massive breakout!
10/02/2024 12:00
Optimism (OP) could see a 70% surge if it breaks key resistance at 3000 sats, analyst Michaël van de Poppe suggests.

- Analyst sees OP breaking 3000 sats as crucial for a major bullish rally.
- Increasing network activity and accumulation suggest OP could be primed for upward movement.
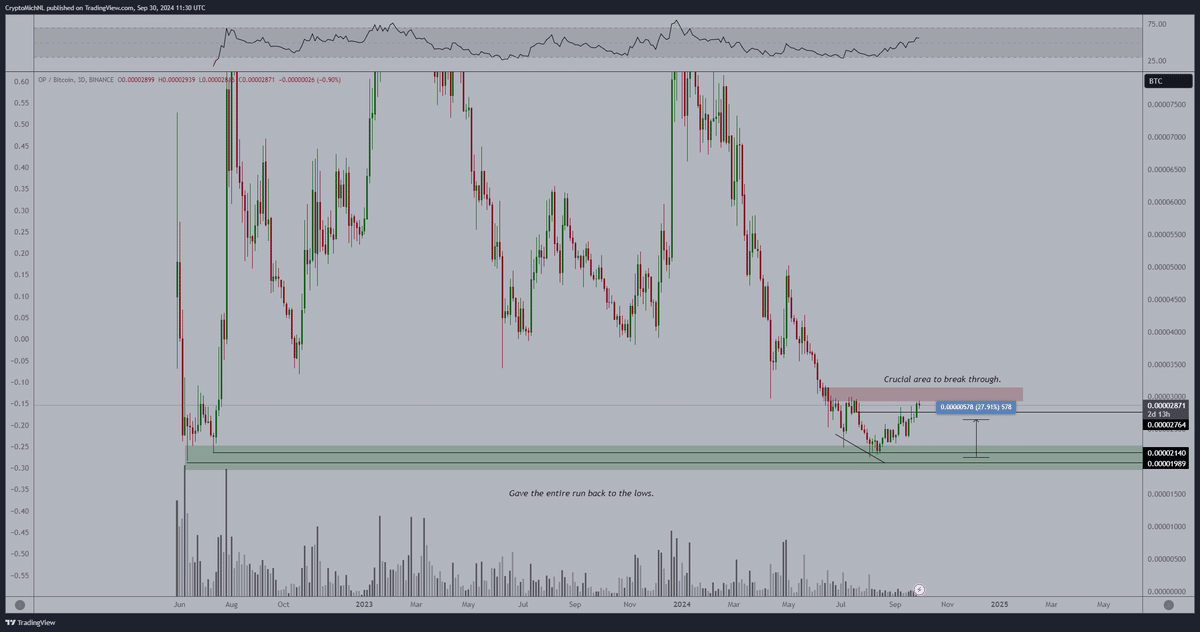
Optimism [OP] has been showing strong upward movement recently, hinting at a possible bullish breakout. Michaël van de Poppe, a crypto analyst, has identified a bullish divergence, where lower lows in price contrast with higher lows in the Relative Strength Index (RSI).
This pattern often indicates the potential for upward momentum. Van de Poppe highlights 3000 sats as a crucial resistance level that OP needs to surpass for continued gains.
Source: X
If Optimism successfully breaks through this resistance, it could pave the way for a rally toward 4500-5000 sats. On the downside, the 2000-2150 sats range has acted as a reliable support zone, with the price repeatedly bouncing off this level.
While the recent rally has returned the price to key levels, any failure to break above resistance could lead to further consolidation.
Price action and indicators suggest volatility
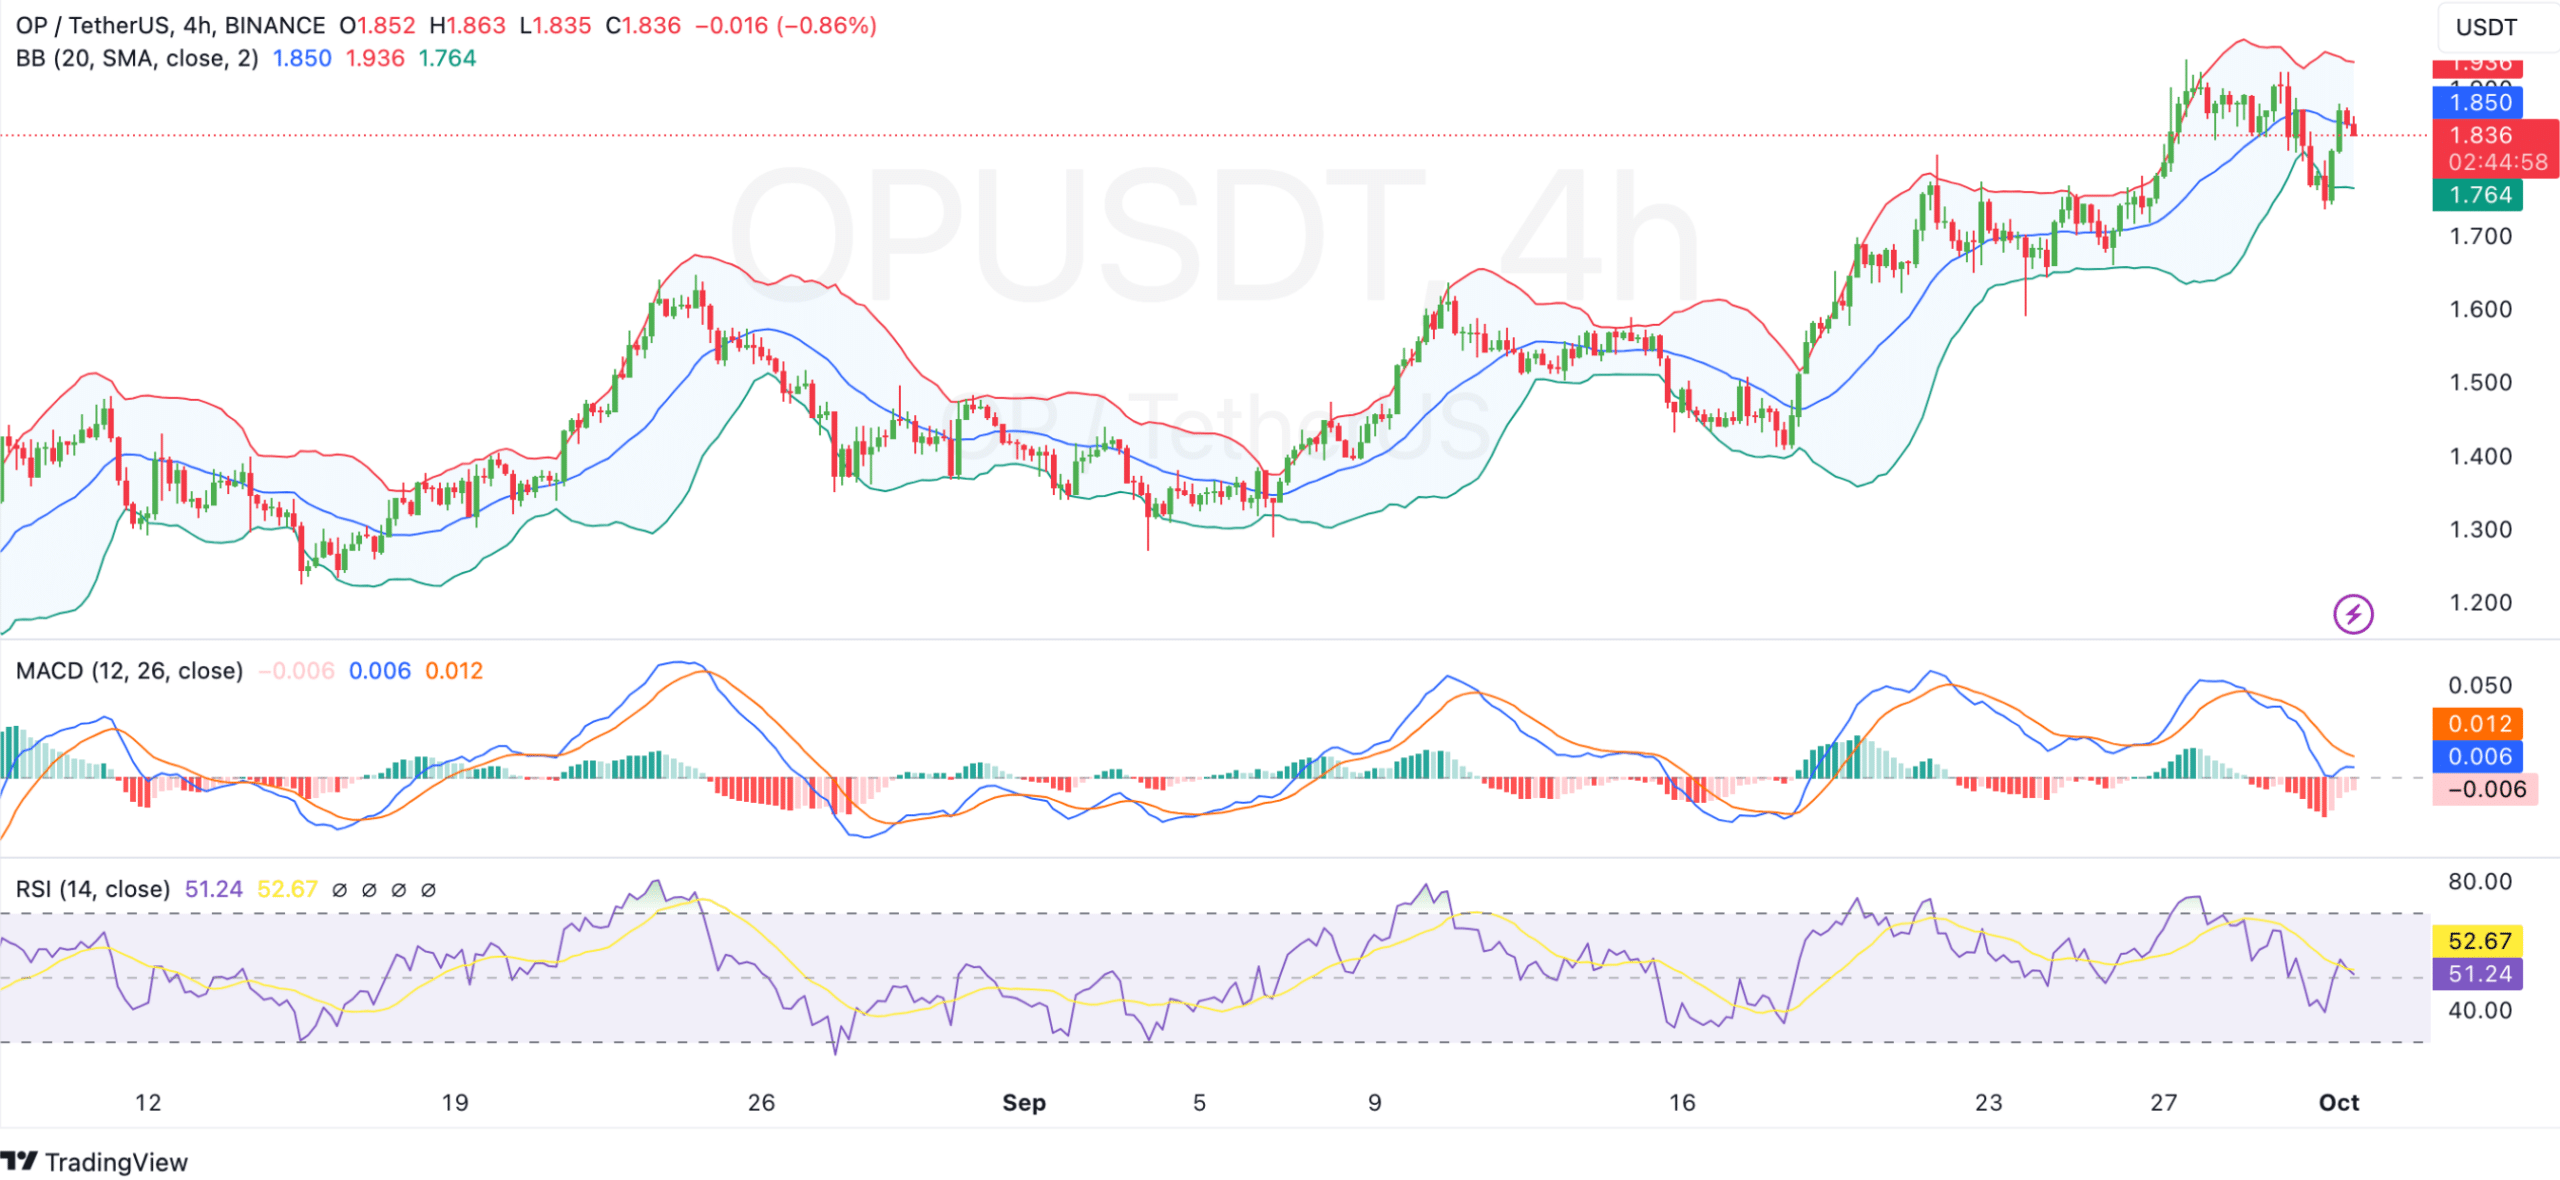
Optimism’s price action remains volatile, fluctuating within the Bollinger Bands on the 4-hour chart. The recent price touched the upper band around $1.85, which acts as immediate resistance, while the middle band at $1.76 serves as dynamic support.
These indicators suggest that while OP is attempting to break out, it is also facing significant resistance at current levels.
Source: TradingView
The Moving Average Convergence Divergence (MACD) is signaling a potential bearish crossover, which indicates weakening bullish momentum. The RSI is neutral at 51.24, showing that the market is neither overbought nor oversold.
Given these mixed signals, traders might see further consolidation unless a strong breakout occurs soon.
OP token flow shows accumulation signs
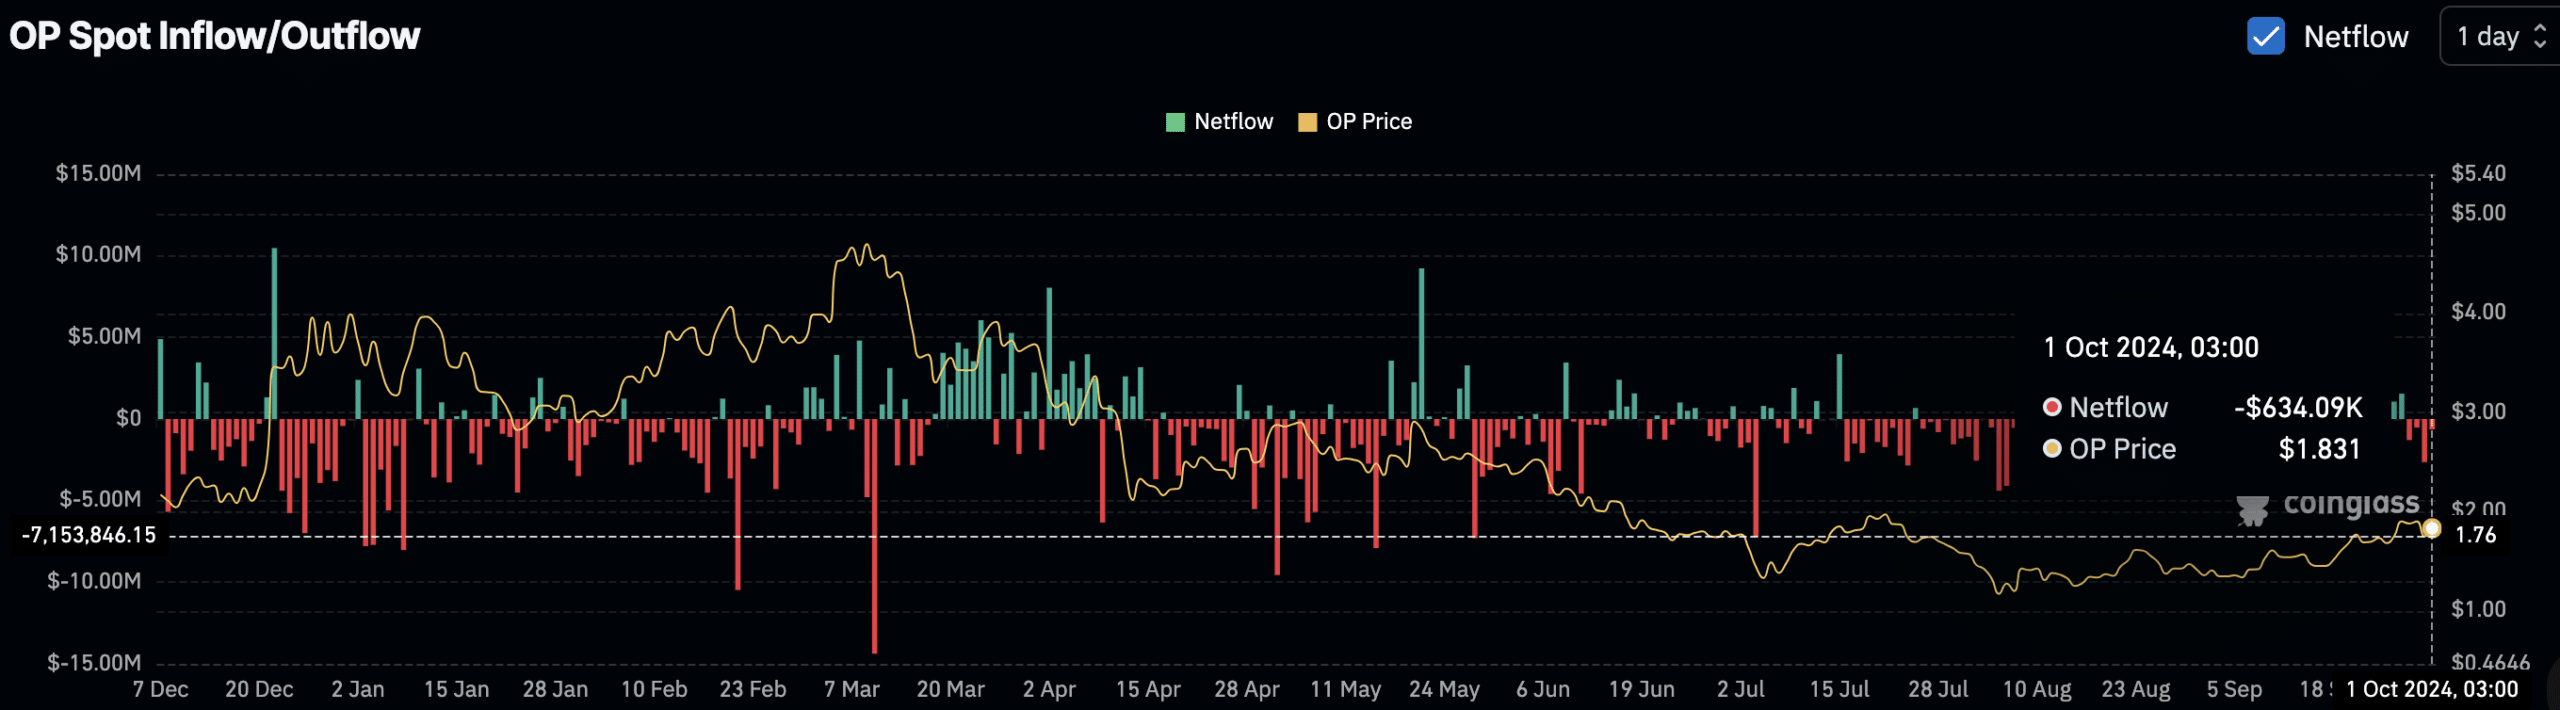
According to recent data, OP tokens are increasingly being moved off exchanges, which could indicate accumulation by investors. As of 1st October, net outflows of $634.09K were recorded on spot exchanges.
This suggests that more tokens are being withdrawn from exchanges than deposited, potentially signaling reduced selling pressure and anticipation of future gains.
Source: Coinglass
Historically, negative netflows like this often correlate with periods of price accumulation as investors hold onto their assets rather than selling them.
However, a significant increase in inflows would indicate renewed selling pressure, which could hinder the price from moving higher.
Increasing network activity
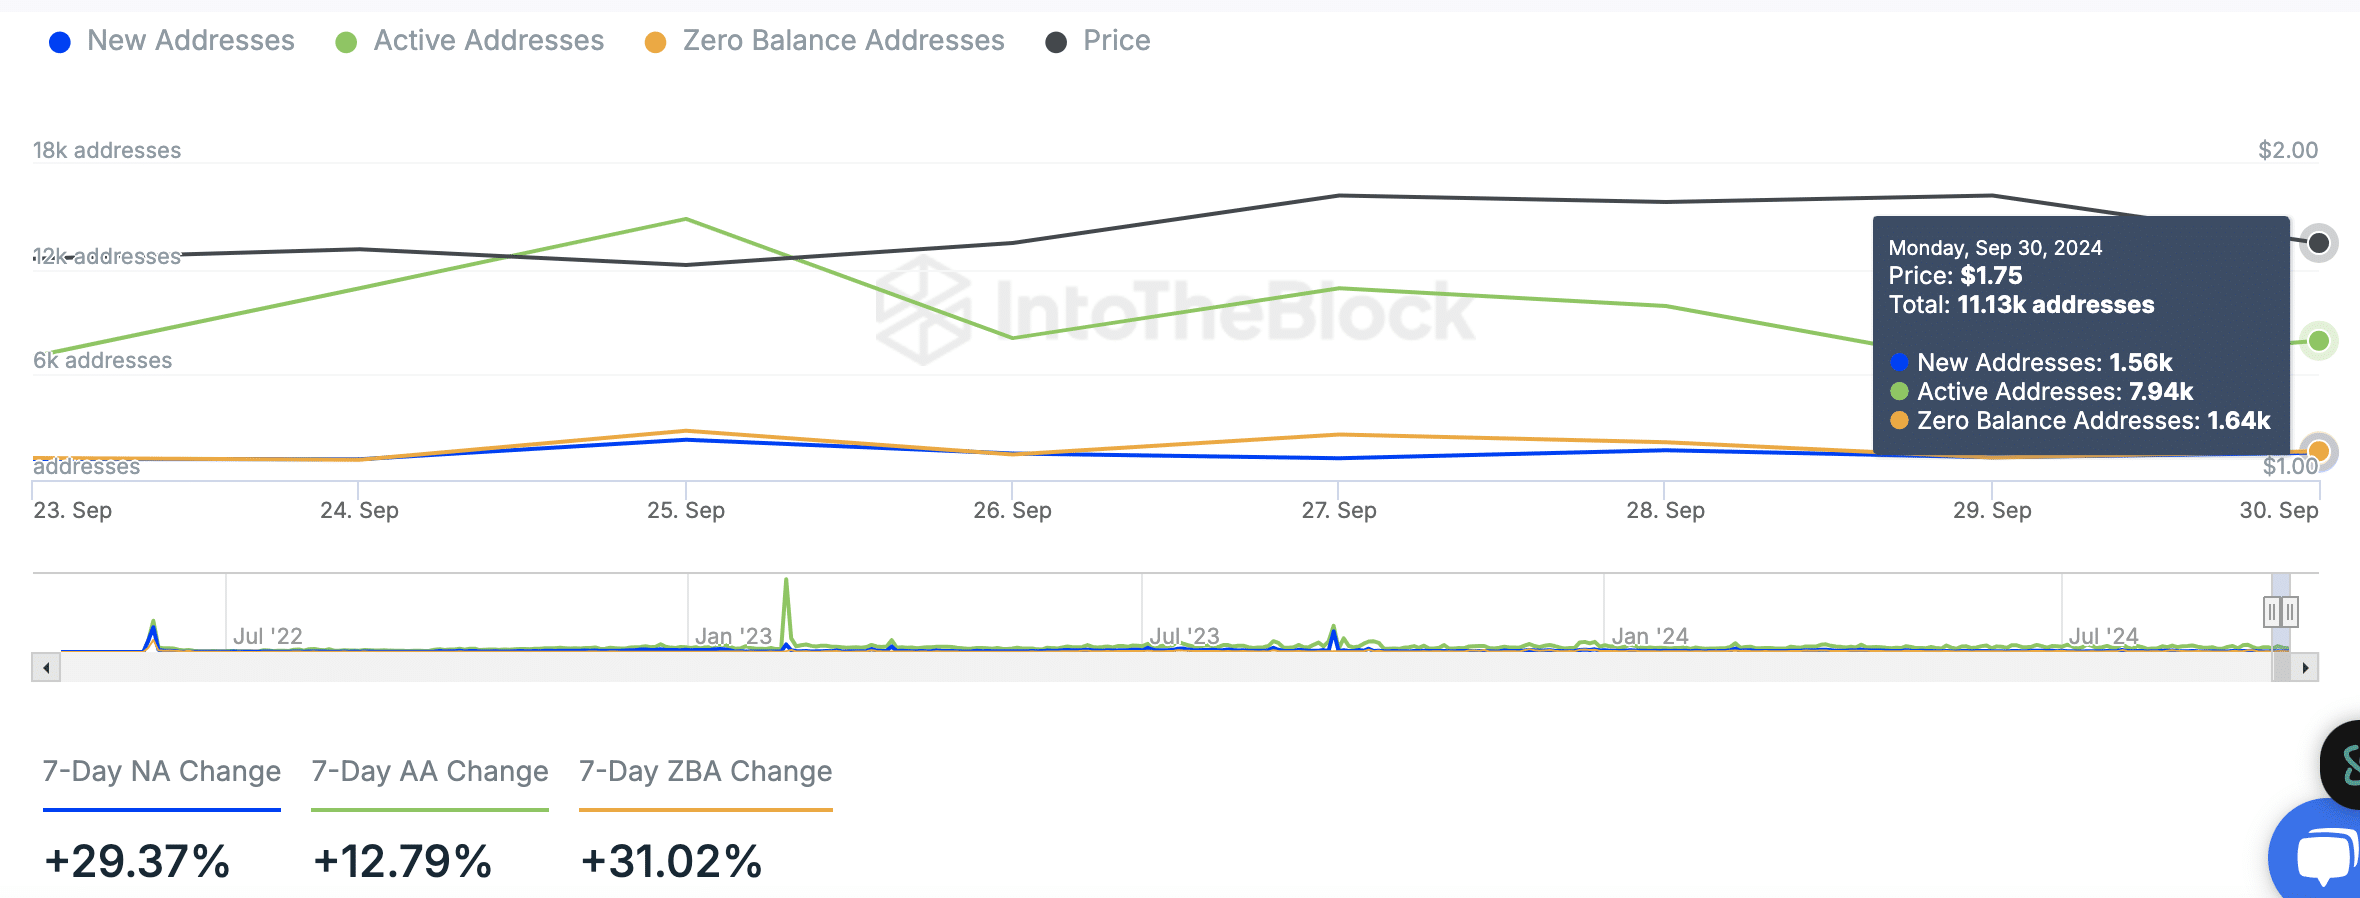
Network data from IntoTheBlock shows a steady increase in new and active addresses for OP. On 30th September, there were 11.13k total addresses, including 1.56k new addresses and 7.94k active addresses.
The rise in new addresses by 29.37% over the past seven days reflects growing interest in the OP token.
Source: IntoTheBlock
Similarly, active addresses increased by 12.79%, indicating more users are interacting with the network.
Additionally, zero-balance addresses—those with no tokens—grew by 31.02%, which could suggest users are preparing for future transactions or moving assets off-chain.
This increase in address activity highlights ongoing engagement with the OP network and indicates that the token continues to attract new users.
Realistic or not, here’s OP market cap in BTC’s terms
As of press time, OP was trading at $1.85, with a 24-hour trading volume of $224,485,832, reflecting a 2.28% price increase in the last 24 hours and a 10.77% increase over the past week.
These metrics indicate that Optimism is maintaining strong market interest despite overall market volatility.