Bitcoin (BTC) $65,000 Jump: What Was It? Solana (SOL) Paints Hidden Price Pattern, Dogecoin (DOGE) Lost Its Reversal Chance
10/09/2024 07:01
While digital gold made substantial return, things are still too complicated

Disclaimer: The opinions expressed by our writers are their own and do not represent the views of U.Today. The financial and market information provided on U.Today is intended for informational purposes only. U.Today is not liable for any financial losses incurred while trading cryptocurrencies. Conduct your own research by contacting financial experts before making any investment decisions. We believe that all content is accurate as of the date of publication, but certain offers mentioned may no longer be available.
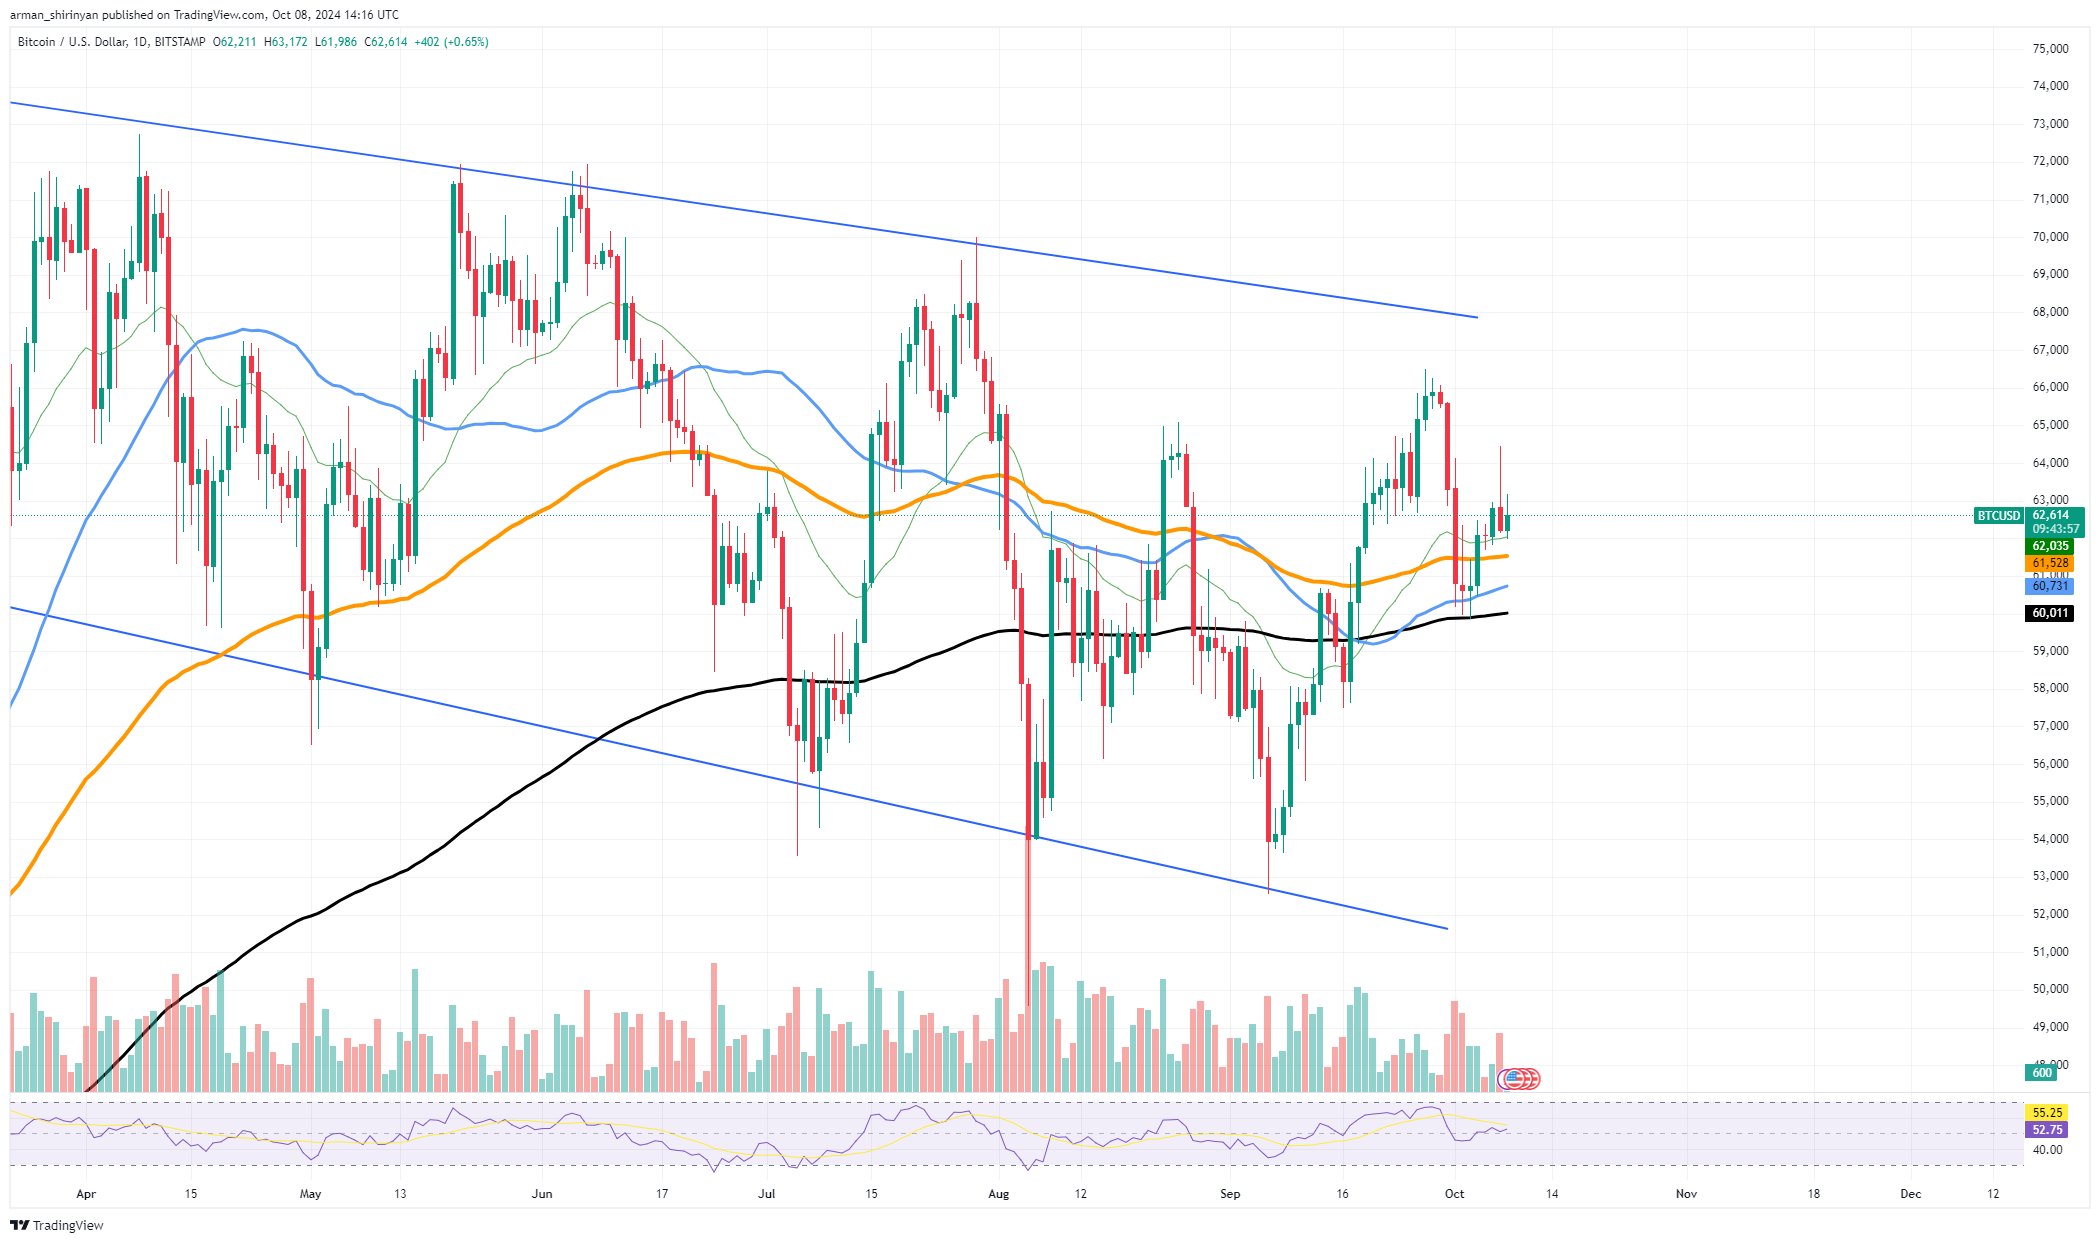
Recently there was a significant surge in the price of Bitcoin bringing it very near to $65,000. Many participants on the market were taken aback by the sudden and swift action. But just as quickly as Bitcoin's value increased, selling pressure quickly followed, which caused a sharp decline in price.
A classic illustration of how volatile Bitcoin can be, particularly when liquidity thins out, is this price knife on the chart. The price action that took place up until $65,000 looked encouraging, but the subsequent reversal shows that BTC is having difficulty keeping up its upward momentum. There was not enough follow-through to maintain the gains despite the initial excitement surrounding the sharp move, which begs the question of whether BTC will be able to reach this level of growth again soon.

As of right now, Bitcoin is trading at roughly $62,000, with resistance at $65,000. Stronger volume and buying pressure — something that was absent during the most recent spike — are required if Bitcoin is to stage another run at $65,000. Due to the erratic price action, traders and investors should exercise caution as there is no obvious indication that BTC will rise further in the absence of strong support.
Furthermore, neutral conditions are suggested by technical indicators like the relative strength index, which indicates that while the market is not overheated, there is also not strong momentum to drive Bitcoin higher in the near future. If the crucial support level of $60,000 is not maintained, Bitcoin may revert to earlier values.
Solana's hidden pattern
At the moment, Solana is exhibiting indications of a broadening wedge reversal pattern. A narrow beginning point that widens over time, signifying increasing market volatility and indecision, is what distinguishes this pattern.
Broadening wedge patterns typically result in either a breakout or a breakdown, and Solana is currently at a pivotal point where its next move will determine its course. According to Solana's chart the price is currently trading just above important support levels between $140 and $145.
If SOL can gain sufficient momentum, the broadening wedge pattern indicates that a reversal may be possible. As a ceiling in recent weeks, the $150-$155 resistance zone needs to be broken for the asset to confirm a bullish reversal, according to Solana. The next target, which is in line with earlier highs from September, would be at or near $160 if Solana is able to break through this level with significant volume.
To keep up its current upward momentum, Solana needs to hold support at about $140 on the downside. A breach of this barrier might render the broadening wedge pattern invalid, which might cause a decline toward $135 or even lower. Another crucial technical level to keep an eye on is the 50-day EMA, which is located around $145. If the price stays above this moving average, it will support a potential reversal even more.
Dogecoin misses its chance
Since it was rejected at a crucial stage, Dogecoin has missed its chance for a significant turnaround. The 100-day EMA, which was serving as resistance, turned out to be an impenetrable barrier for DOGE. The probability of a decline has increased as a result of this denial, and the coin is currently under more selling pressure.
Dogecoin encountered resistance at the 100-day moving average (EMA) after attempting to break above $0.12. Since then, the price has begun to decline. If this level is not broken, it indicates that bulls are no longer in control of the market and that the momentum is now with the bears.
This rejection is important because it represented the critical turning point where DOGE had the opportunity to break its prior downward trend. Now that the 100-day EMA has been rejected, Dogecoin is vulnerable to more drops. The psychological barrier at $0.10, which has served as support in previous trading sessions, is the next level of support to keep an eye on.
The next significant support is located around $0.09, and if DOGE breaks below this level, the downtrend may quicken. If DOGE wants to have any chance of a reversal, it must recover the $0.12 level. Dogecoin's short-term downward momentum may continue unless there is an abrupt surge in buying pressure based on the current price action. The asset appears ready for more losses, and traders should keep an eye on the important support levels up ahead in light of the unsuccessful breakout attempt at the 100-day EMA.

