Skyrocketing or Catastrophe: Two Major Bitcoin (BTC) Price Levels
10/18/2024 15:32
Bitcoin can see major volatility surge if this key level is broken

Disclaimer: The opinions expressed by our writers are their own and do not represent the views of U.Today. The financial and market information provided on U.Today is intended for informational purposes only. U.Today is not liable for any financial losses incurred while trading cryptocurrencies. Conduct your own research by contacting financial experts before making any investment decisions. We believe that all content is accurate as of the date of publication, but certain offers mentioned may no longer be available.
Right now, there are two significant liquidation thresholds that Bitcoin is positioned between, and knowing which way the price will go in the future is crucial. Key levels at roughly $68,900 and $66,000 that are likely to affect price action are highlighted on the Binance BTC/USDT liquidation heatmap.
The risk of heightened volatility rises as BTC approaches these thresholds, which serve as important liquidation points. Depending on which level is tested first, BTC may see a breakout or breakdown under such pressure from both directions. The higher level, approximately $68,900, corresponds to a significant resistance level.
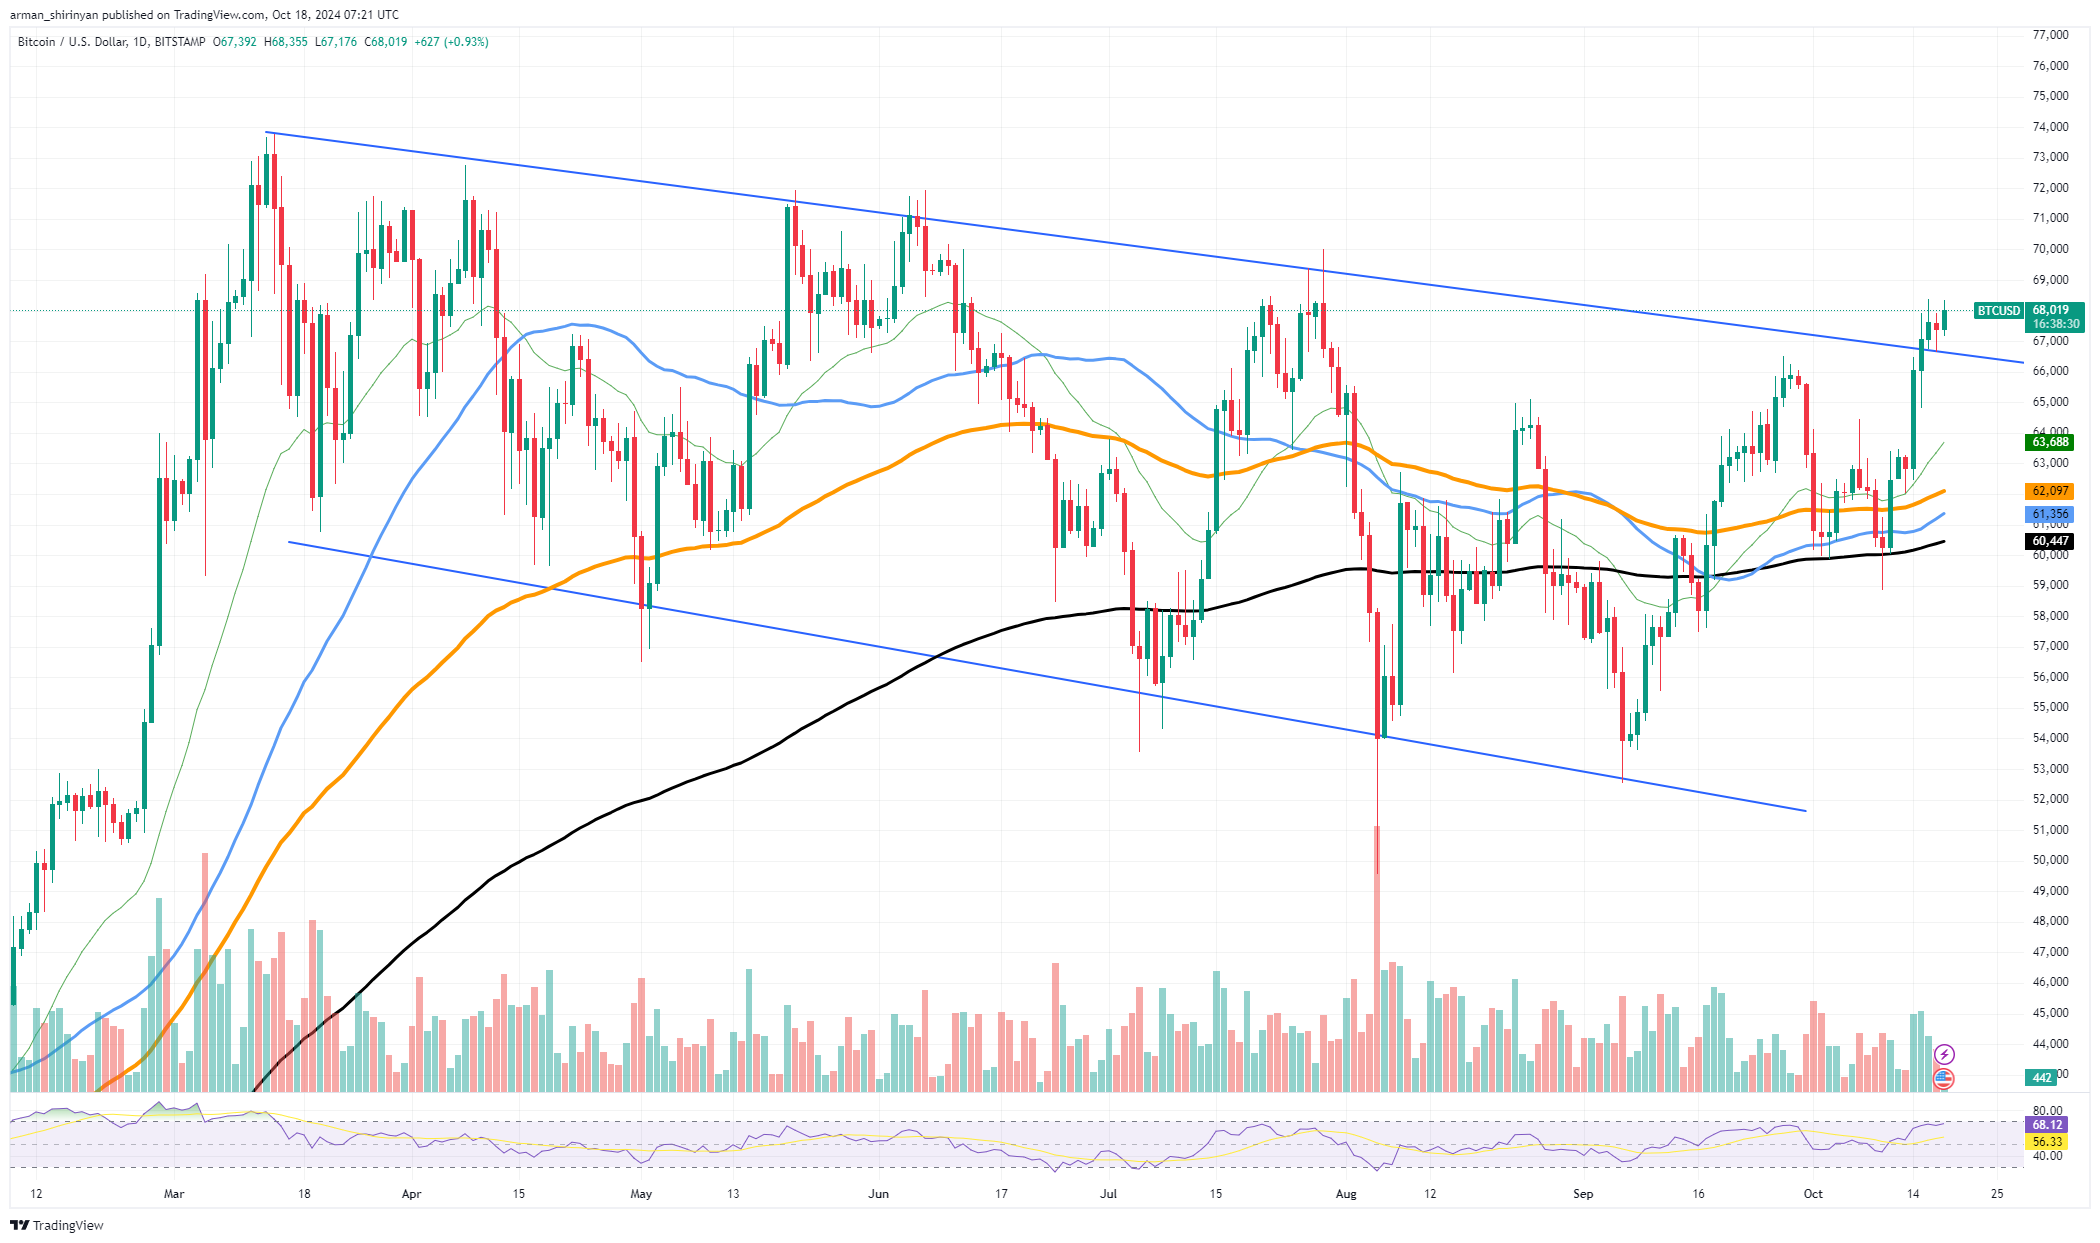
A new bullish wave may be initiated if Bitcoin surpasses this barrier and sees a sharp price increase. However, a decline below $66,000 might set off a chain reaction of selling that would push prices lower and possibly even cause a significant sell-off. Based on the given price chart, it is evident that Bitcoin has encountered difficulties in breaking above the $67,970 mark in recent times.
Related

Moving averages are also getting tighter on the chart; the 50, 100 and 200 EMAs in particular are all converging. Sharp price changes, either upward or downward, frequently precede this convergence. The trend of declining volume, which indicates hesitancy among traders, is even more worrisome.
This may suggest that even though there is a local uptrend for Bitcoin, strong buying momentum may keep it from breaking out of this narrow range. A breakdown would put the important support level at $66,000 to the test which, depending on its success, could either serve as a safety net or trigger a sharp decline.
With volatility predicted to spike higher as these thresholds get closer, the next move is probably going to be significant. Traders should be ready for swings either way, contingent on how Bitcoin responds to pressure in between these pivotal points.