Polkadot mirrors key 2020 pattern: Here’s what it means for DOT traders
10/19/2024 06:00
DOT has surged by 3.7% over the past week. Market indicators show Polkadot is experiencing strong positive market sentiment

- DOT surged by 3.7% over the past week.
- Market indicators showed Polkadot was experiencing strong positive market sentiment.
Polkadot [DOT] has experienced favorable market conditions over the past month. As such, DOT has seen moderate gains on its price charts since hitting a local low of $3.8.
In fact, at the time of writing, Polkadot was trading at $4.253. This marked a 2.83% surge on monthly charts, with the extension of this bullish trend by 3.70% in 7 days.
Despite the gains, DOT remained relatively low from its recent high of $6.477 and approximately 92.27% below its ATH of $55.
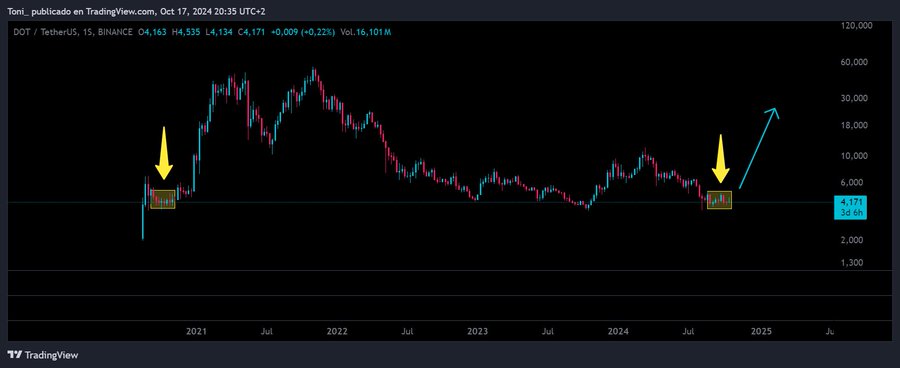
As expected, the recent gains have left analysts talking over the altcoin’s trajectory. One of these analysts is the popular crypto analyst Toni Bitcoin who has suggested that DOT is mirroring 2020.
What market sentiment says
In his analysis, Toni posited that Polkadot is currently mirroring the accumulation period of October 2020.
Source: X
In context, when Polkadot experienced months of accumulation starting from October 2020, DOT experienced a parabolic surge.
As such, following accumulation during this period, DOT was strong enough to rally. The altcoin surged from $3.5 to $6.093.
A breakout from this level saw DOT surge to $42.361 and reach ATH months later. This was a historical rally, surging by 730.59%.
What DOT charts suggest…
If DOT repeats the 2020 pattern, the altcoin will see a historical surge.
Although the analysis provided by Toni provides a positive outlook, it’s essential to determine what other market indicators suggest.
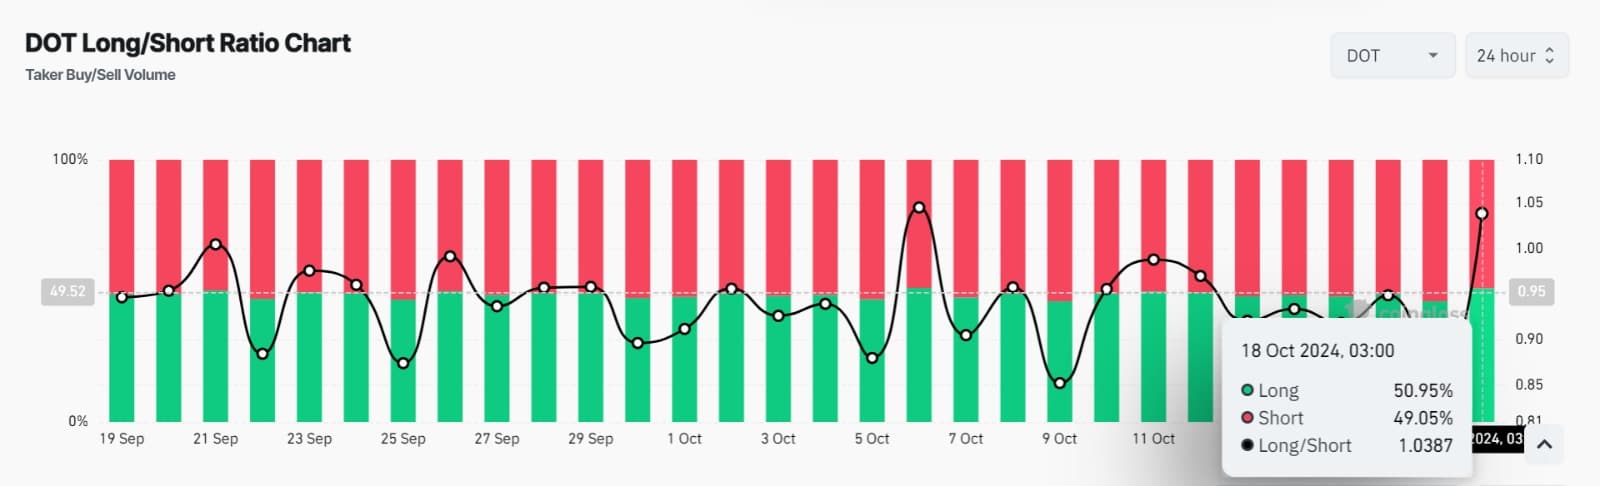
Source: Coinglass
Polkadot’s Long/Short Ratio remained above 1 over the past 24 hours. This suggests that many investors are taking long positions, thus longs are dominating the market.
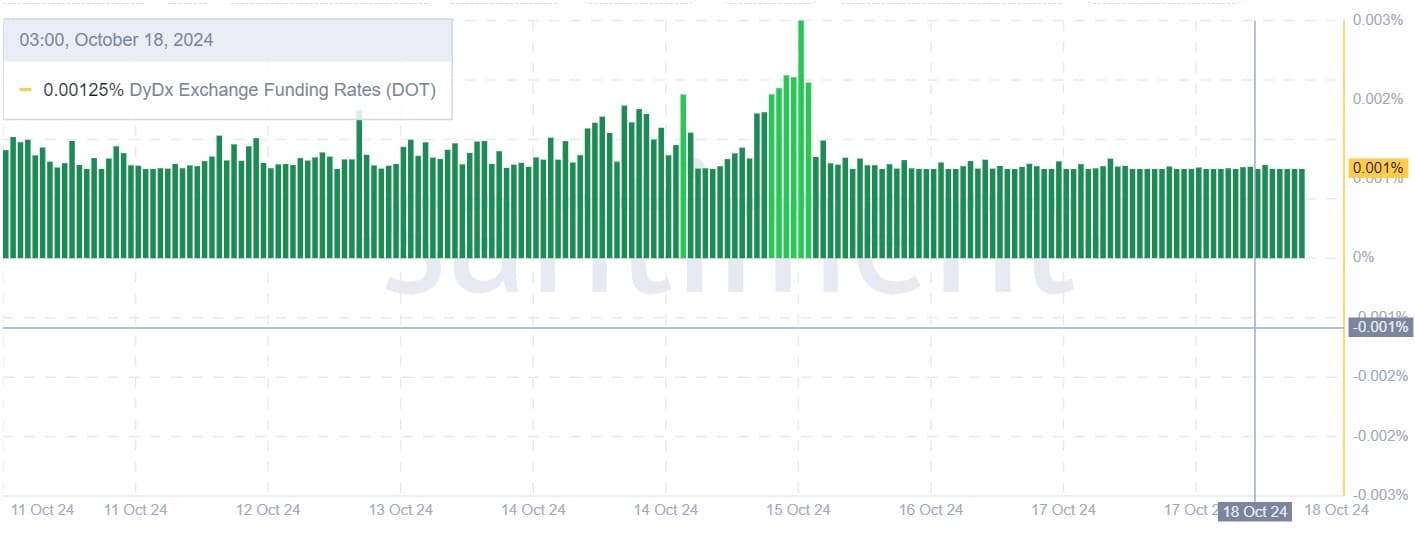
Source: Santiment
This demand for long positions is further supported by a positive DyDx exchange funding rate.
This shows that longs are confident with the market and are willing to pay shorts during downturns to hold their positions.
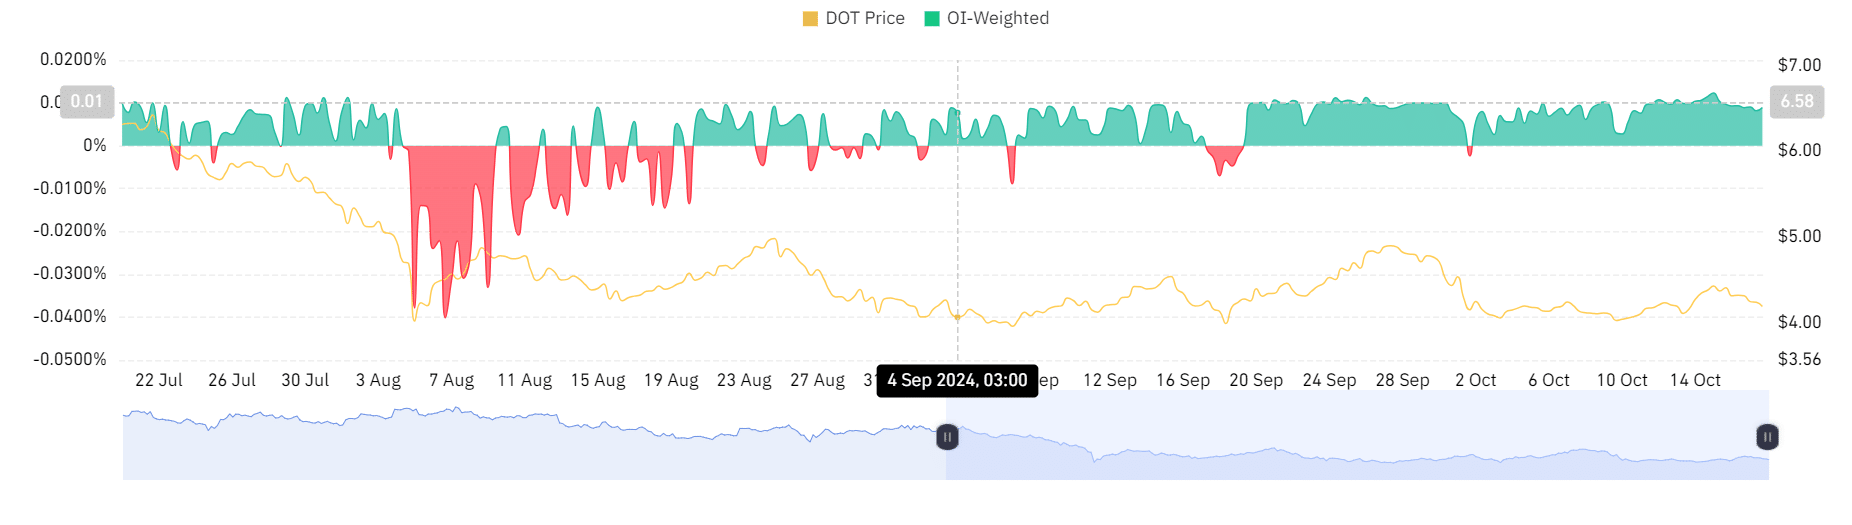
Source: Coinglass
Additionally, a positive OI-weighted funding rate strengthens our earlier observation regarding a high demand for long positions.
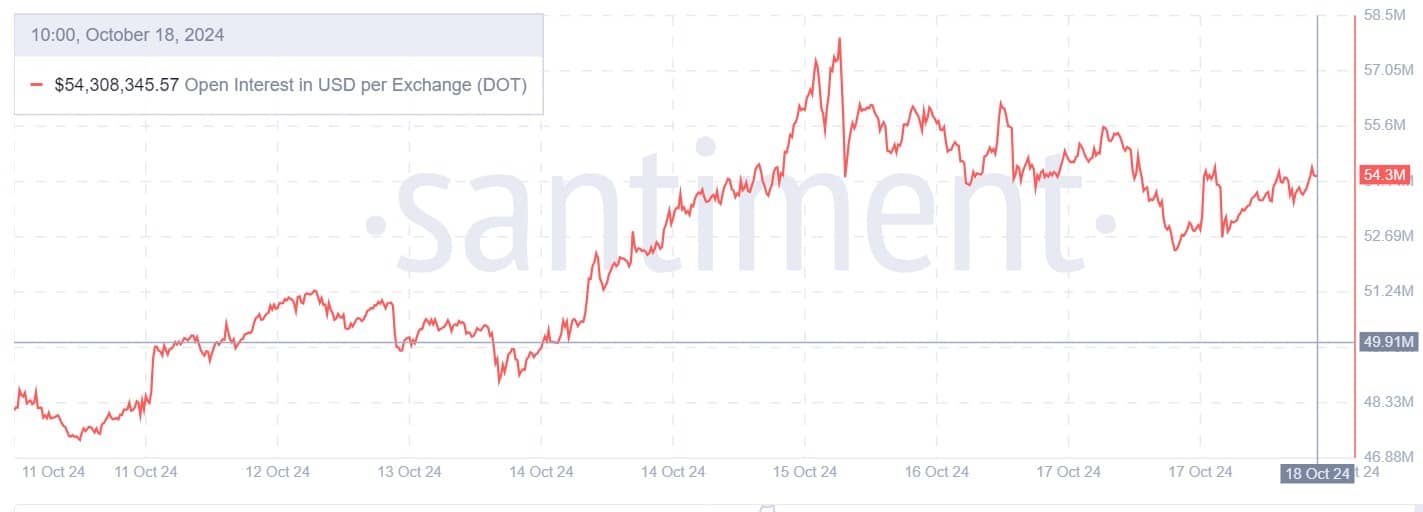
Source: Santiment
Finally, Polkadot has seen a sustained rise in open interest per exchange. This has increased from $47 million to $54.3 million at press time. With a high demand for long positions, this shows that the new position openings are largely longs.
Read Polkadot’s [DOT] Price Prediction 2024-25
Simply put, DOT is experiencing positive market sentiment and increased investor favorability. Thus, if these conditions hold, DOT will attempt the next critical resistance level at $5.0. In a bullish scenario, a breakout from this level will strengthen the altcoin to hit $6.4.
Therefore, a rally as predicted by the earliest will mean 3 months of accumulation, with a historical rally occurring from January to February 2025.