Bitcoin: Why a dip to $66k might be necessary for BTC’s next move
10/24/2024 02:00
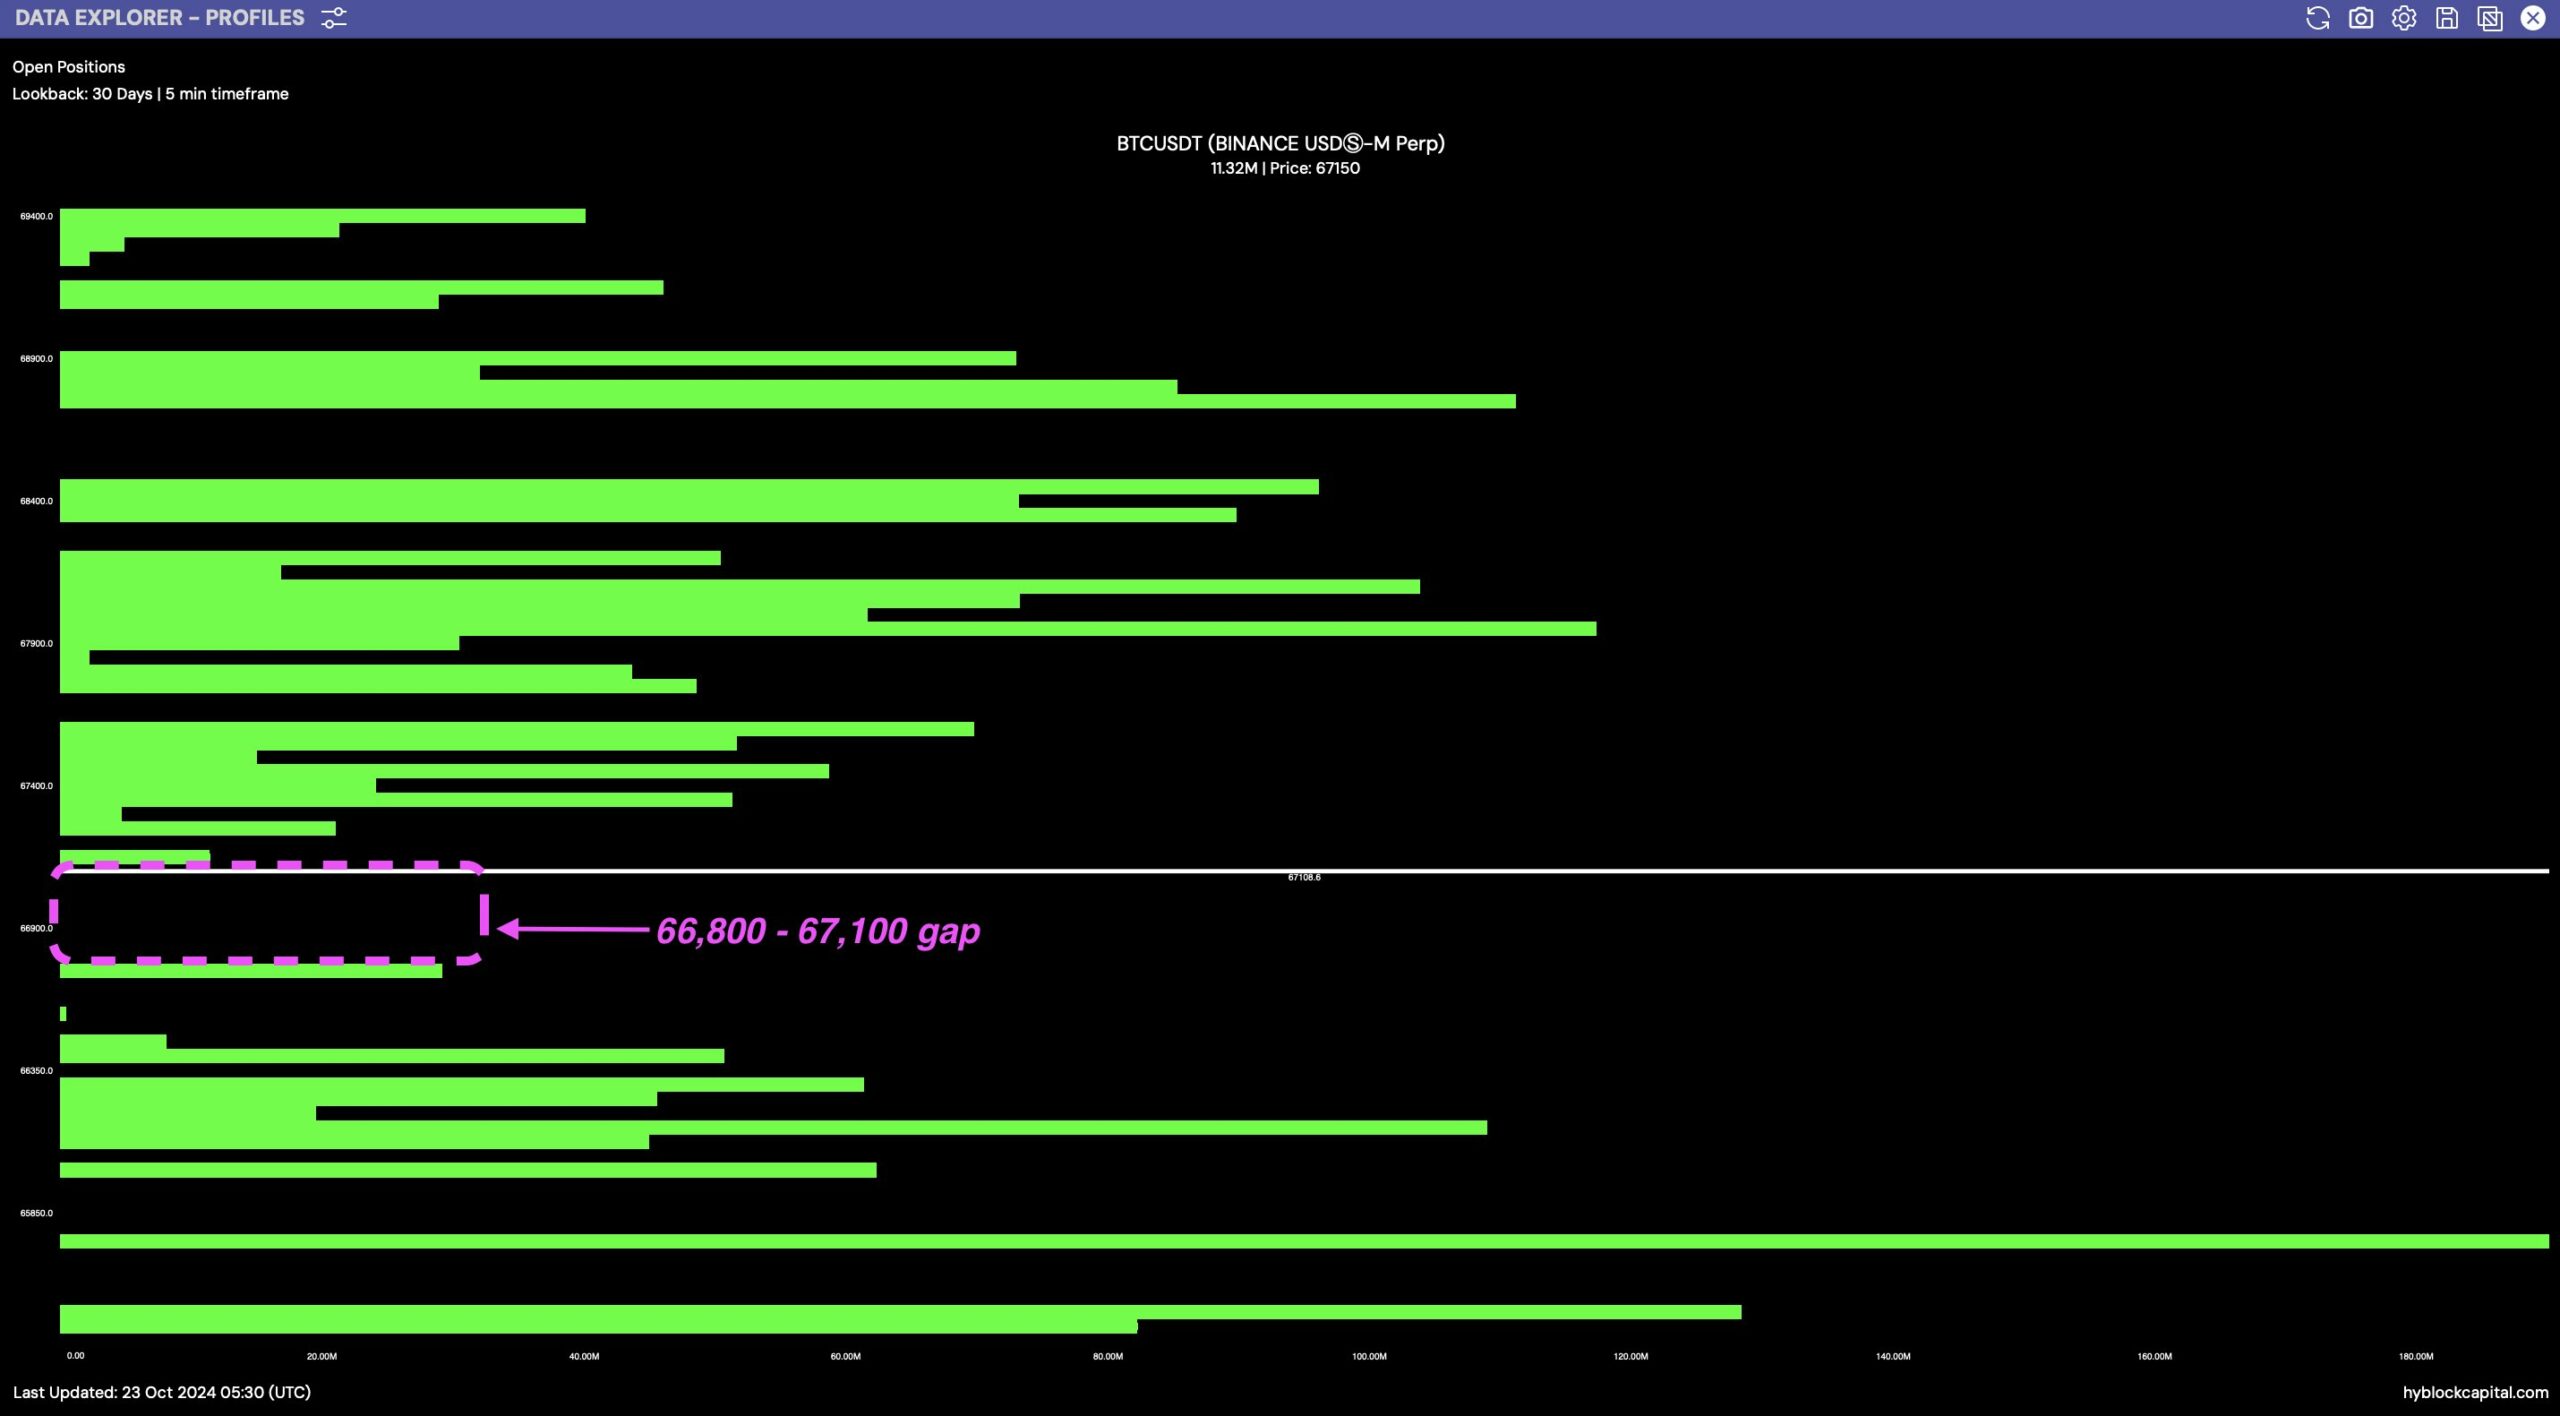
The Bitcoin profile chart shows fewer position s at $66.8K to $67.1K zone, indicating a price gap that needs filling.

- Bitcoin poised to retrace to $66K before a bounce.
- Global liquidity to potentially continue rising up to 2026.
Bitcoin [BTC] was navigating a critical price range at press time, with market watchers anticipating its next move. The $66.8K to $67.1K zone on Bitcoin’s profile chart shows fewer positions, indicating a price gap.
Historically, price tends to gravitate toward such gaps to fill them before continuing a trend.
Bitcoin’s path forward hinges on whether it fills this gap before pushing higher or retraces further to gather liquidity.
BTC heading towards a gap
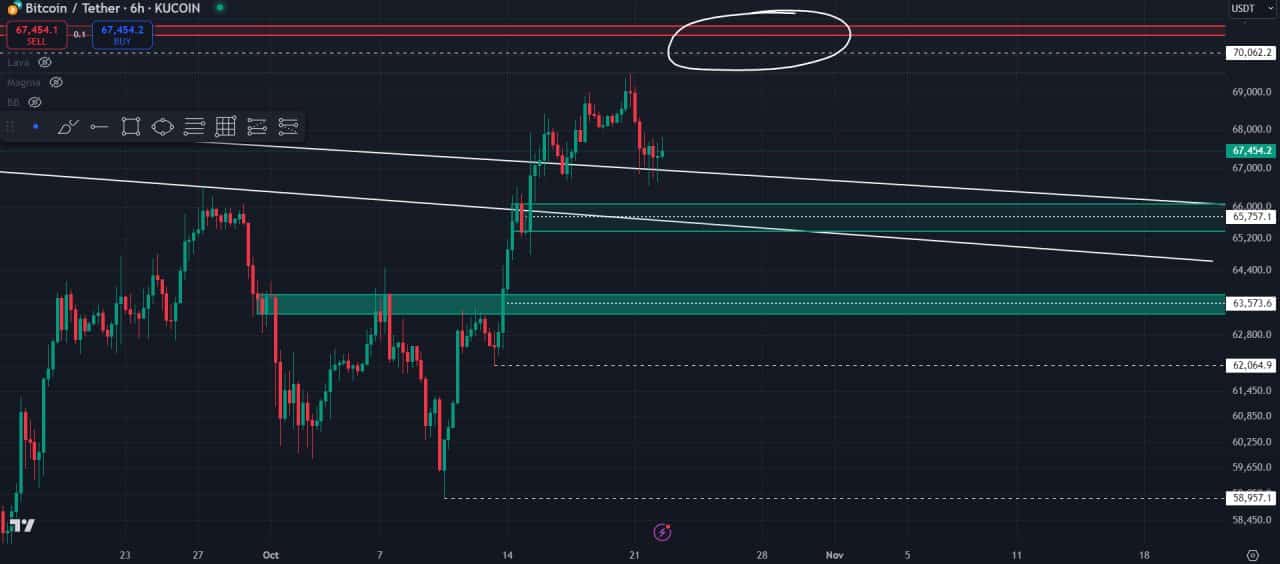
BTC’s price action shows a slight correction after hitting the $70K level, a major milestone for the cryptocurrency.
The retracement suggests that Bitcoin is gathering momentum for its next leg up, but first, it may need to fill the gap in the $66.8K-$67.1K range.
This zone lies below a key double bottom pattern on the 6-hour timeframe of the BTC/USDT pair, reinforcing the potential for upward movement once the gap is filled.
The weekly chart remains bullish, with the structure broken to the upside, indicating strong market support.
Traders are closely watching this price action, with many expecting Bitcoin to hold at the $70K-$71K level, which would likely trigger a move into price discovery and a new all-time high.
The filling of the gap in this price range could also act as a liquidity grab, allowing Bitcoin to gather strength before making a decisive move higher.
A successful breakout past $70K would signal the start of a new bullish phase, with Bitcoin potentially entering uncharted territory.
Profitability and global M2 supply
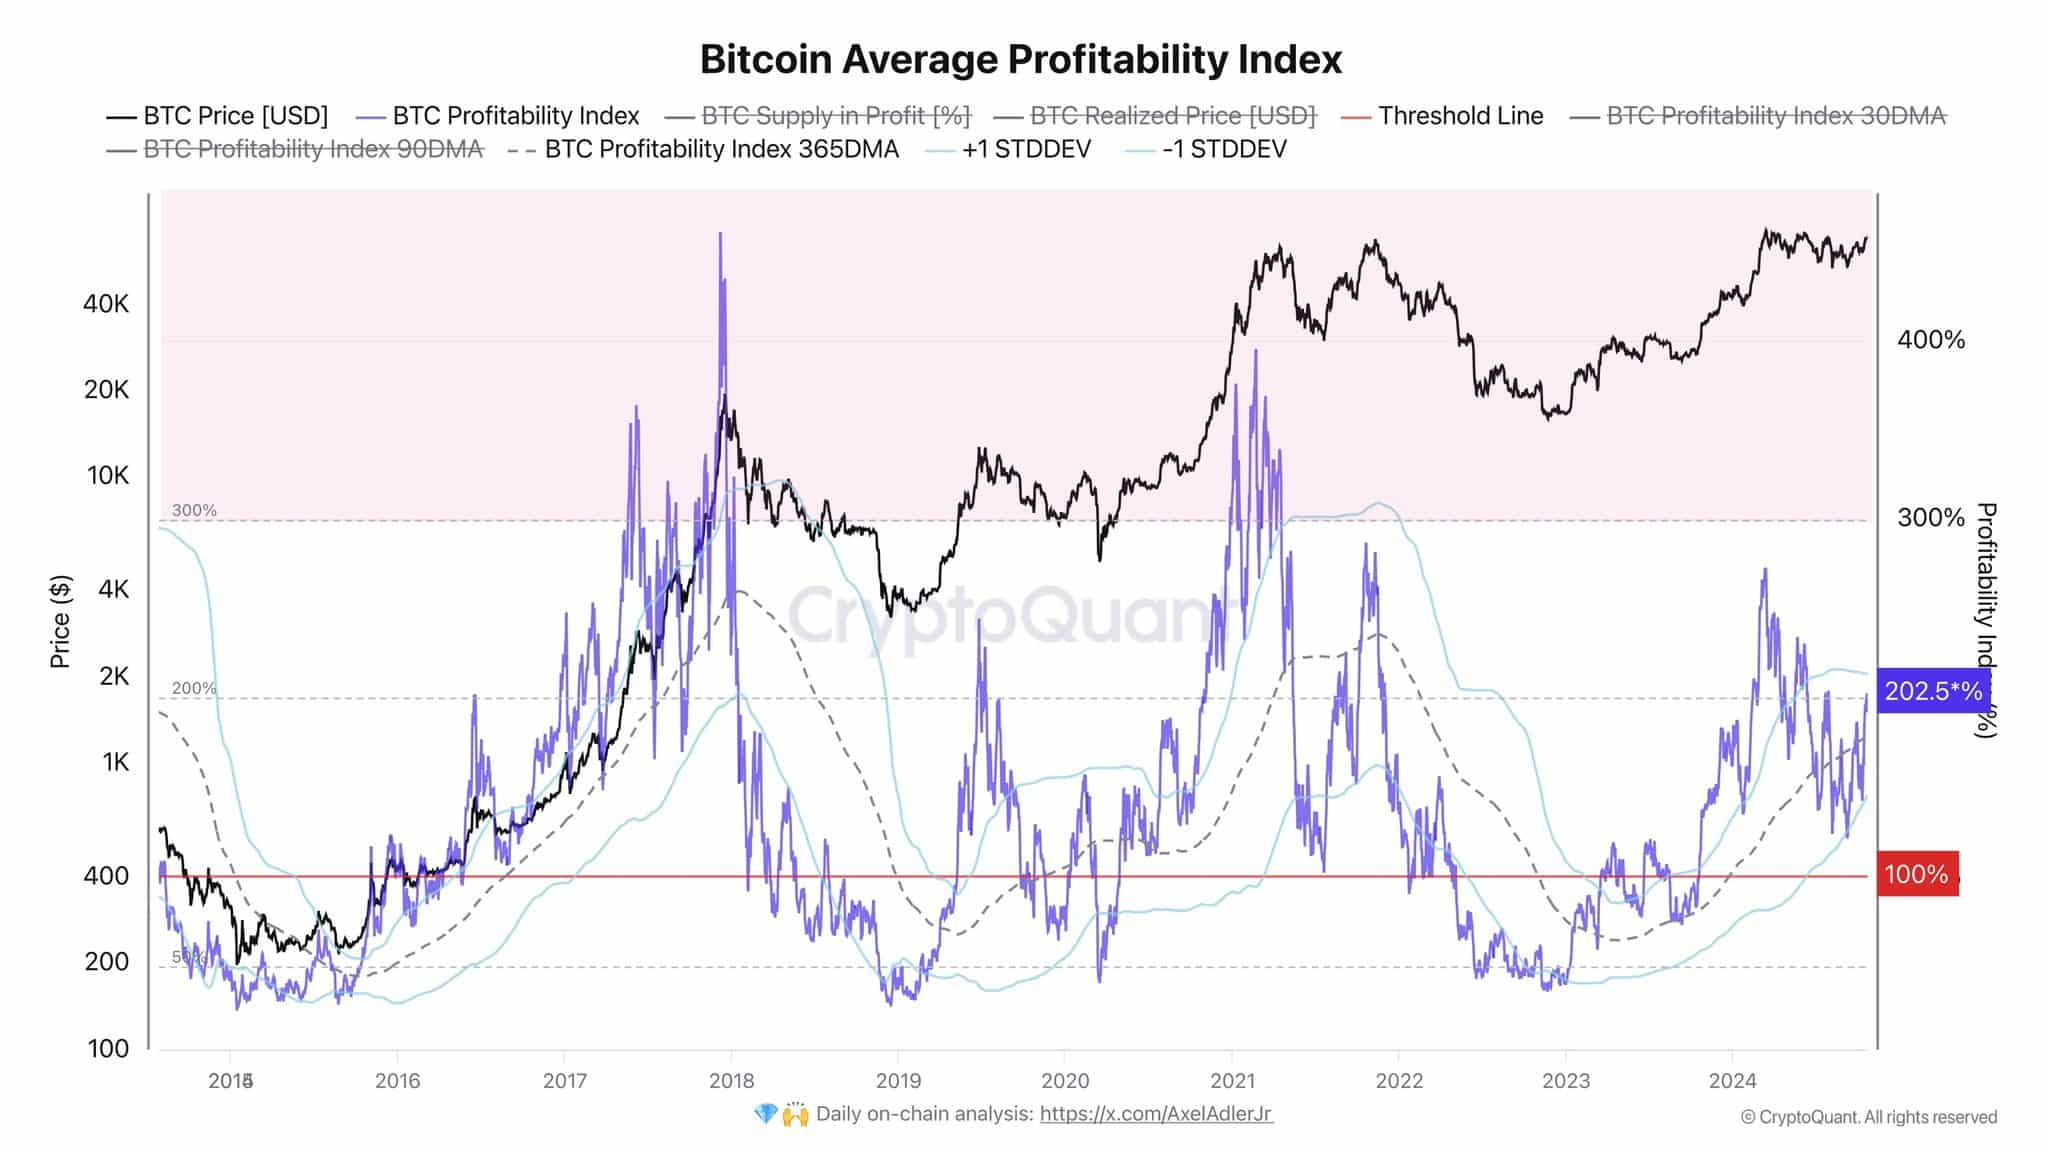
The Bitcoin Average Profitability Index further supports this outlook. Currently, the index stands at 202%, meaning the price is more than double the realized price.
Historically, investors tend to start taking profits when this index rises above 300%, but for now, it suggests that the market is not yet in heavy profit-taking mode.
This leaves room for BTC to continue its upward trajectory after filling the price gap, with long-term holders still optimistic about higher price levels.
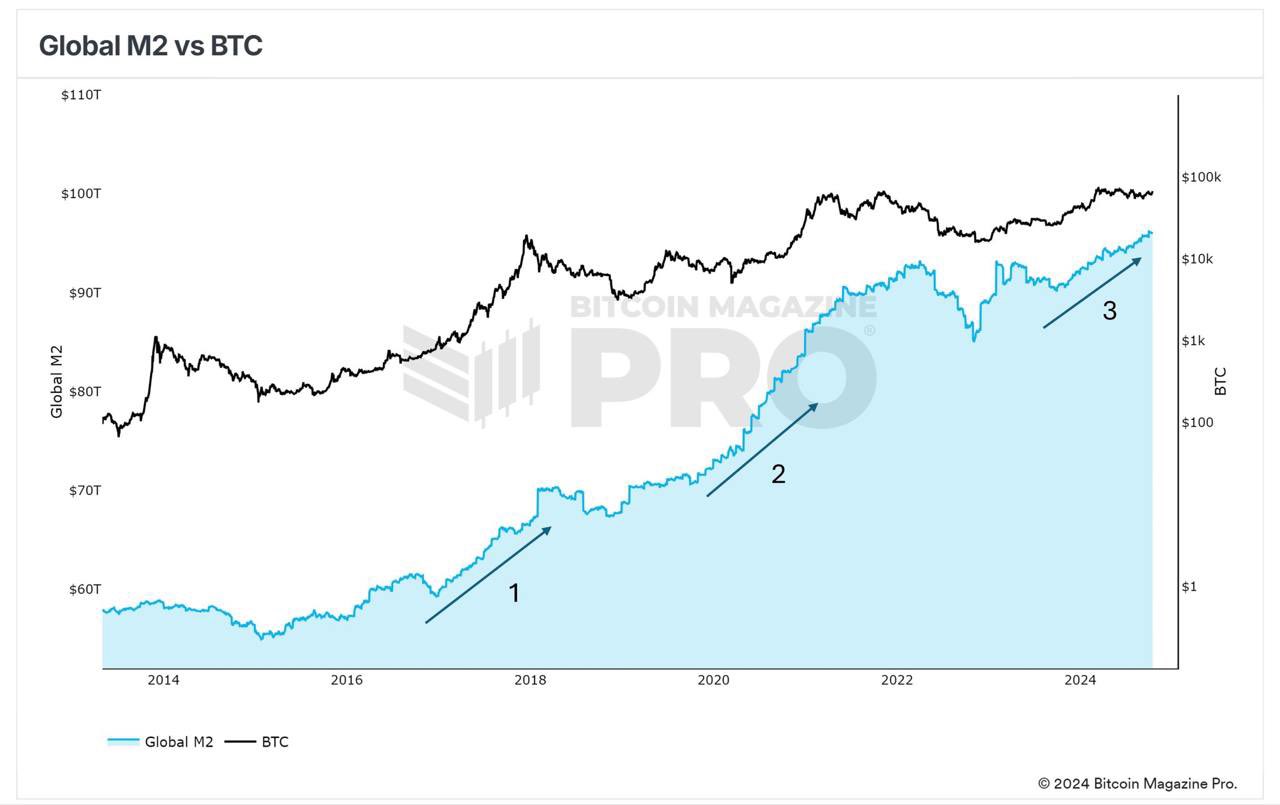
In addition to these indicators, the Global M2 money supply data offers insights into Bitcoin’s broader potential.
During previous bull cycles, such as in 2016-2017, the expansion of the M2 supply coincided with significant Bitcoin price growth.
In 2021, a similar expansion occurred, but external factors like the collapse of FTX and rising interest rates dampened Bitcoin’s momentum.
Read Bitcoin’s [BTC] Price Prediction 2024-25
If the M2 supply continues to grow through mid-2026, as some analysts predict, this could provide additional liquidity to the market and extend Bitcoin’s current cycle.Bitcoin’s path remains bullish, with the price gap acting as a short-term support that need to be tapped before rally continuation.


