Ethereum exchange inflows spike: Will U.S. elections spark a bounce?
10/27/2024 13:00
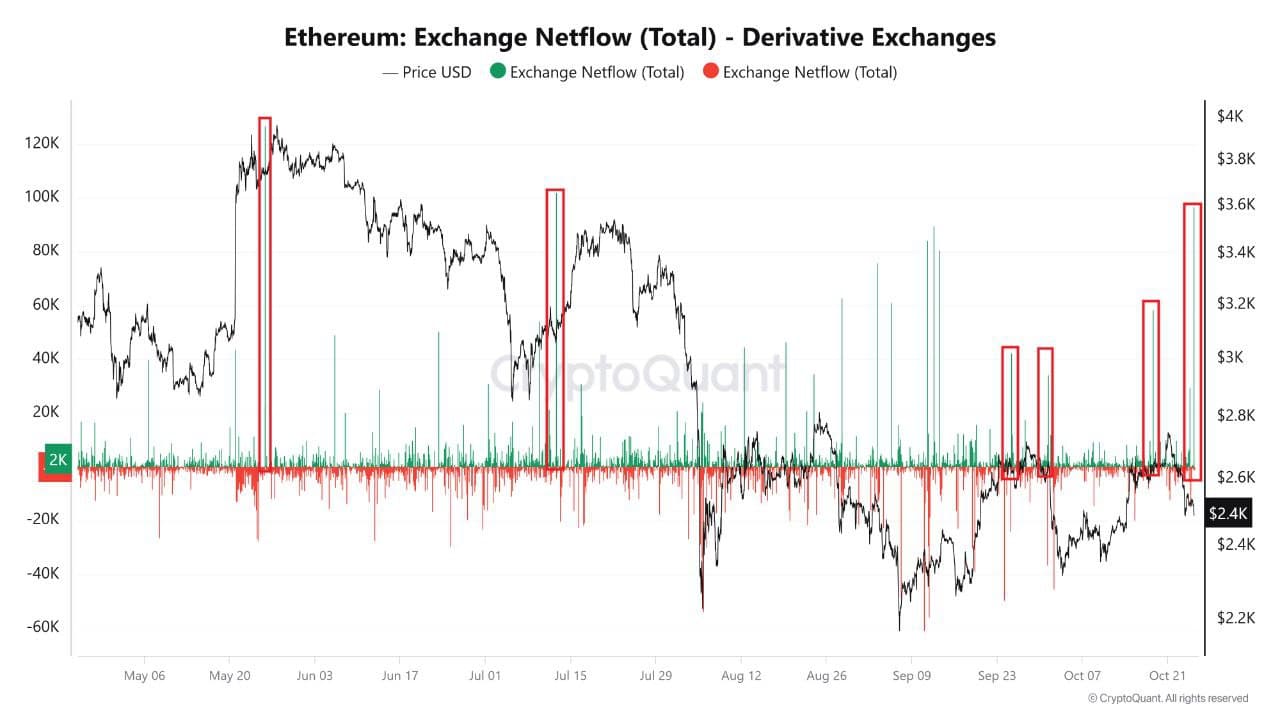
The increase in ETH influx could signal another price correction or possibly set up a major market shift possibly after US elections.

- The markets saw an influx in Ethereum into derivative exchanges.
- Recent charts showed a possible 4-hour bullish divergence on ETH.
Ethereum [ETH], being one of the major cryptocurrencies, has been the subject of discussion as an influx of 96000 ETH into derivative exchanges recently indicated a notable rise in market activity.
Historically, similar inflows led to ETH price swings or downturns, as seen in May and July this year. This increase could signal another price correction or possibly set up a major market shift.
As the year’s final quarter unfolds, Ethereum’s performance might closely follow Bitcoin’s recent breakout from a prolonged consolidation, which spurred optimism across crypto markets.
U.S. elections accompanied by a divergence signal
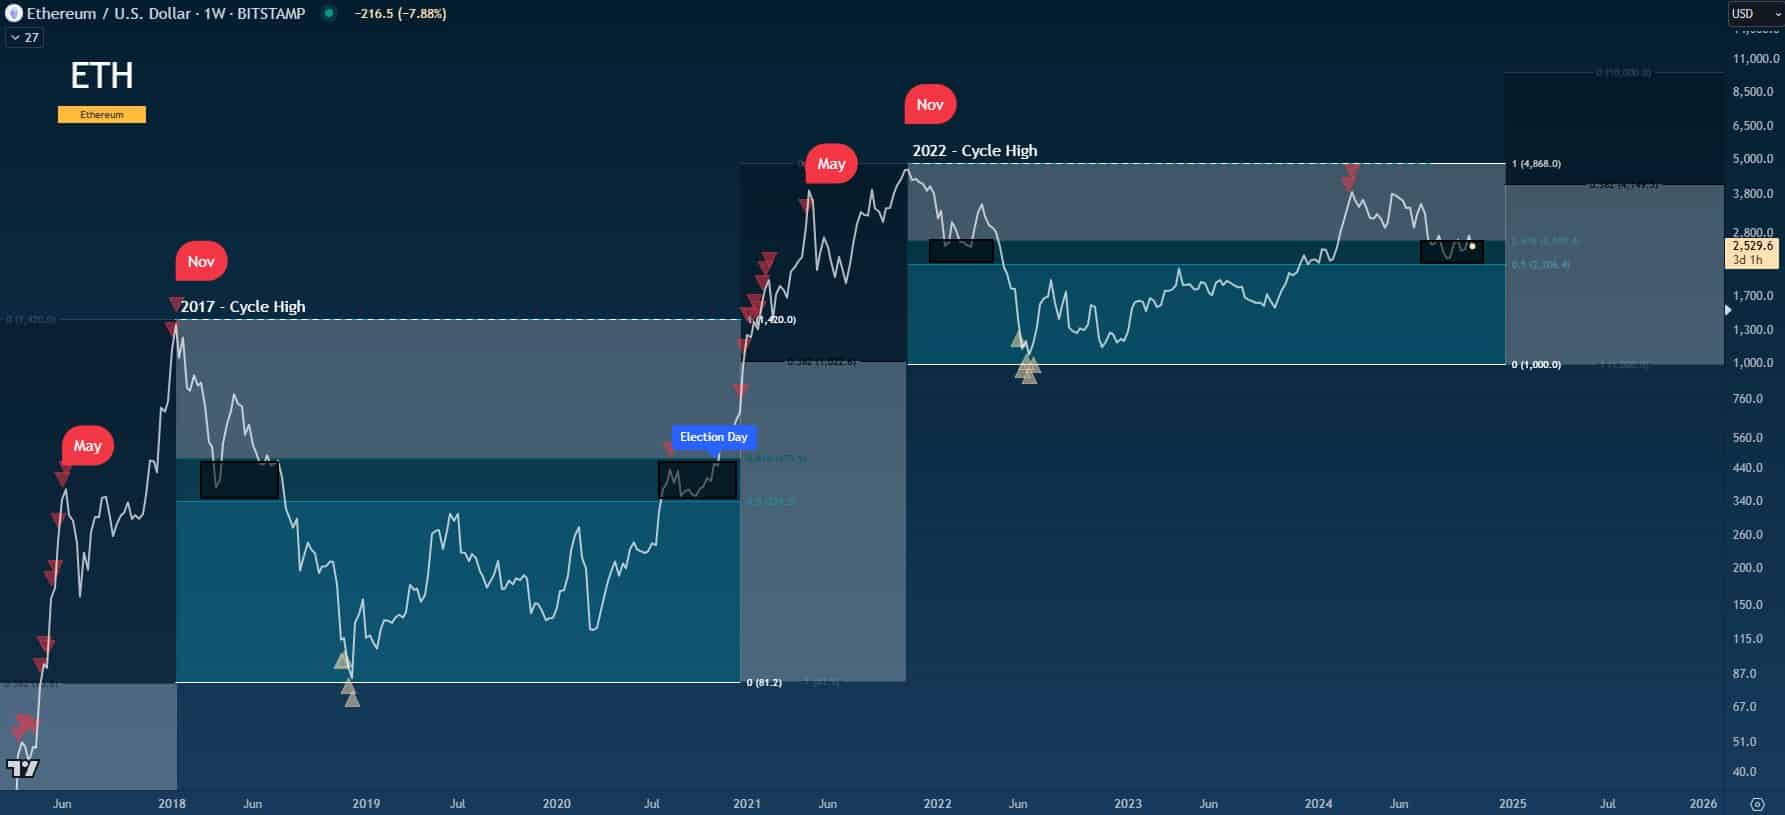
Ethereum’s price action in past U.S. election cycles also supported this trend. During the 2020 elections, ETH surged, breaking out of consolidation.
With the elections now just days away, a similar pattern could occur.
Ethereum might see a rebound if history repeats itself, particularly as many anticipate positive policies on crypto under potential changes in the U.S. administration.
However, this outcome remains speculative as the overall economic and crypto landscape has evolved since 2020.
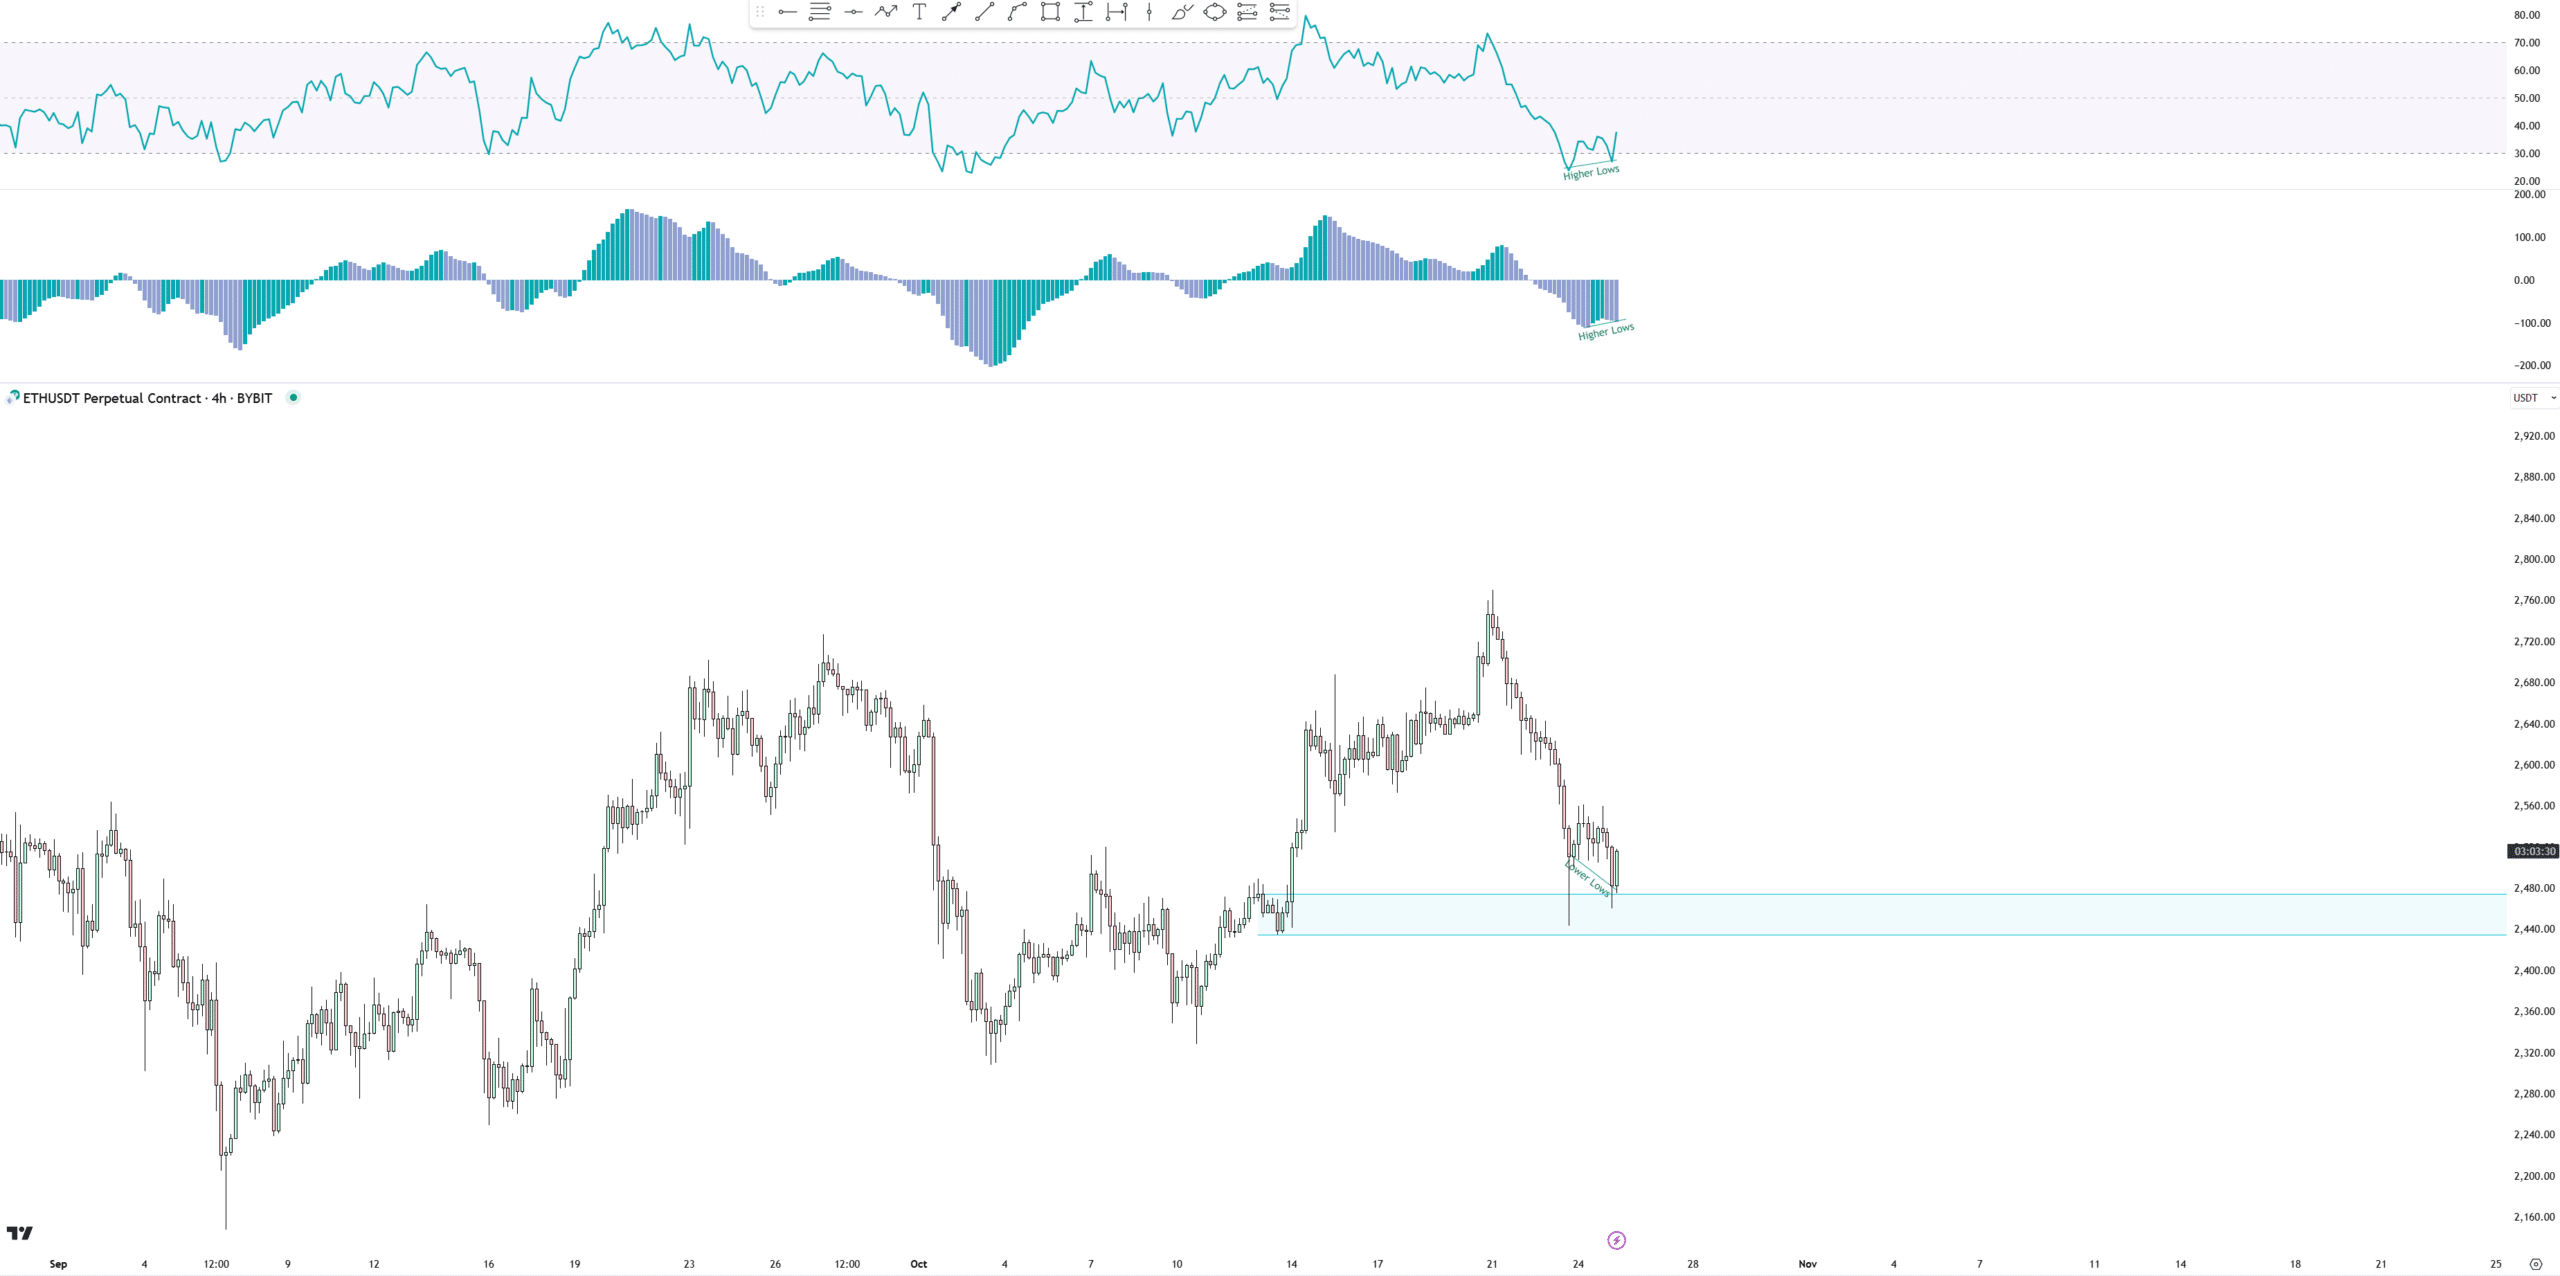
Supporting a potential bullish turn for ETH, recent charts showed a possible 4-hour bullish divergence, signaling a shift in demand.
Although the structure of this demand level appeared irregular, Ethereum showed reactions that could indicate strength.
The divergence structure was clear, and it displayed a double divergence with a clean arc formation, giving a positive outlook.
Most of the negative delta appeared on the first leg of this pattern, which typically signals less selling pressure on the second leg.
However, analysts suggested caution and advised traders to wait for a strong green candle, confirming a reversal, before assuming this would invalidate the bearish outlook.
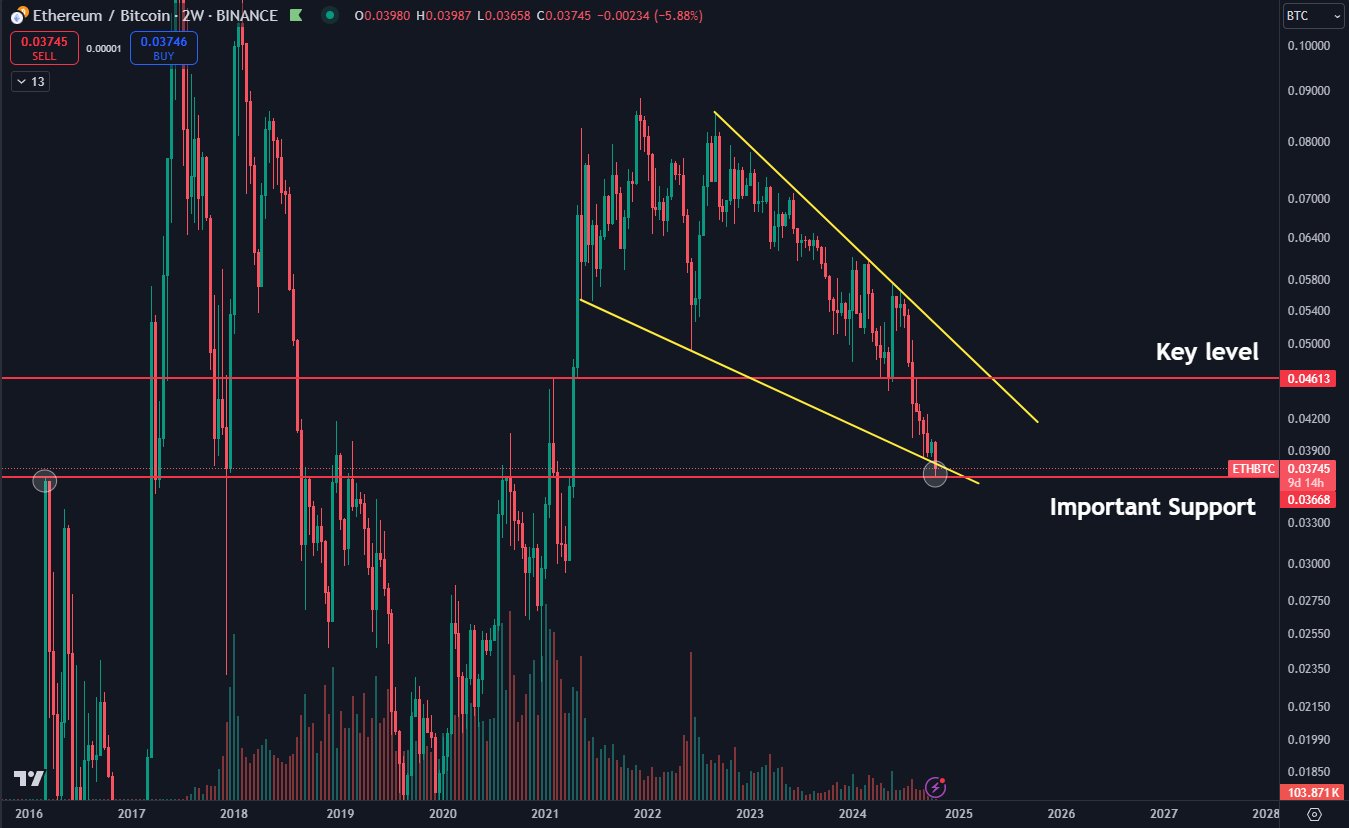
ETH/BTC testing its 2016 highs
In another key development, Ethereum tested its 2016 highs against Bitcoin. Currently, ETH is trading below a long-standing falling wedge pattern, which represents a high-timeframe support level.
Many traders expect ETH could continue to correct against Bitcoin, especially if it struggles to break above this level.
Although Ethereum has shown resilience in the recent market, investor interest remained subdued, keeping its future price movement uncertain.
Should ETH respect this support, it could attract fresh market interest, potentially initiating a market shift either in the remaining months of the year or early next year.
Read Ethereum’s [ETH] Price Prediction 2024–2025
However, until ETH confirms a breakout, a cautious outlook remains prudent for investors.
While significant inflows, election-year trends, and a possible bullish divergence fueled hopes for a rally, ETH must navigate key resistance levels against Bitcoin.


