Pyth Network flips Chainlink with $36B volume: A signal for traders?
11/01/2024 02:00
PYTH's achievement of $36 billion in transaction volume over the past 30 days positions it as a formidable player, overtaking Chainlink.

- Pyth Network’s recent $36 billion transaction volume surge and price breakout signal a potential bullish trend ahead.
- Rising open interest and social dominance reinforce market confidence, positioning Pyth for further price appreciation.
Pyth Network’s [PYTH] recent achievement of $36 billion in transaction volume over the past 30 days positions it as a formidable player, overtaking Chainlink [LINK].
This impressive growth highlights the increasing adoption of Pyth’s innovative pull-based Oracle model, especially within the decentralized finance (DeFi) sector.
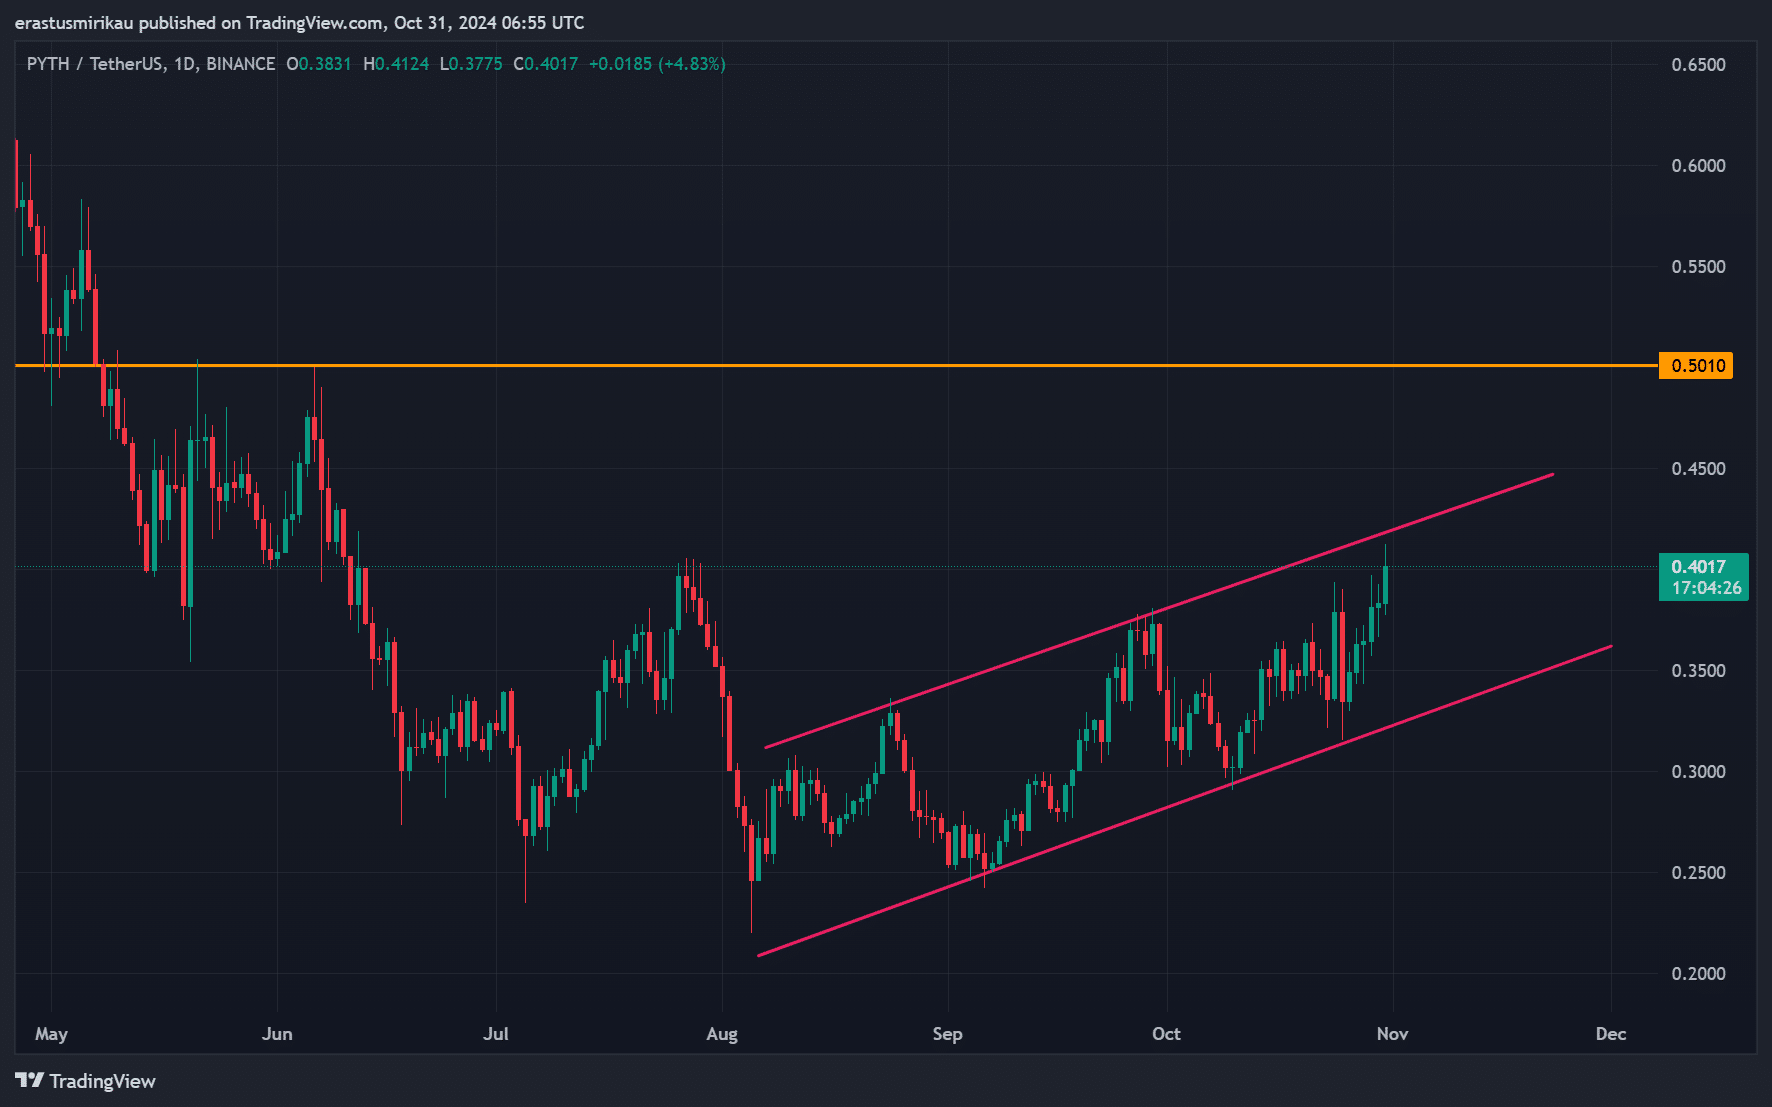
At press time, Pyth trades at $0.4038, reflecting a 5.63% increase in the last 24 hours. Therefore, such momentum suggests that Pyth may capture more market share and attract new investors.
Are we witnessing a breakout? Chart analysis of Pyth Network
Current price action indicates that Pyth has broken out of a well-defined ascending channel. This breakout signals a shift in momentum and suggests that upward pressure might continue. Analysts identify $0.5010 as a crucial resistance level.
If it breaks this barrier, it could trigger further bullish sentiment. Consequently, observing the price movement within this channel reinforces the potential for sustained upward movement in the near term.
What do the indicators say? Analyzing RSI and MACD
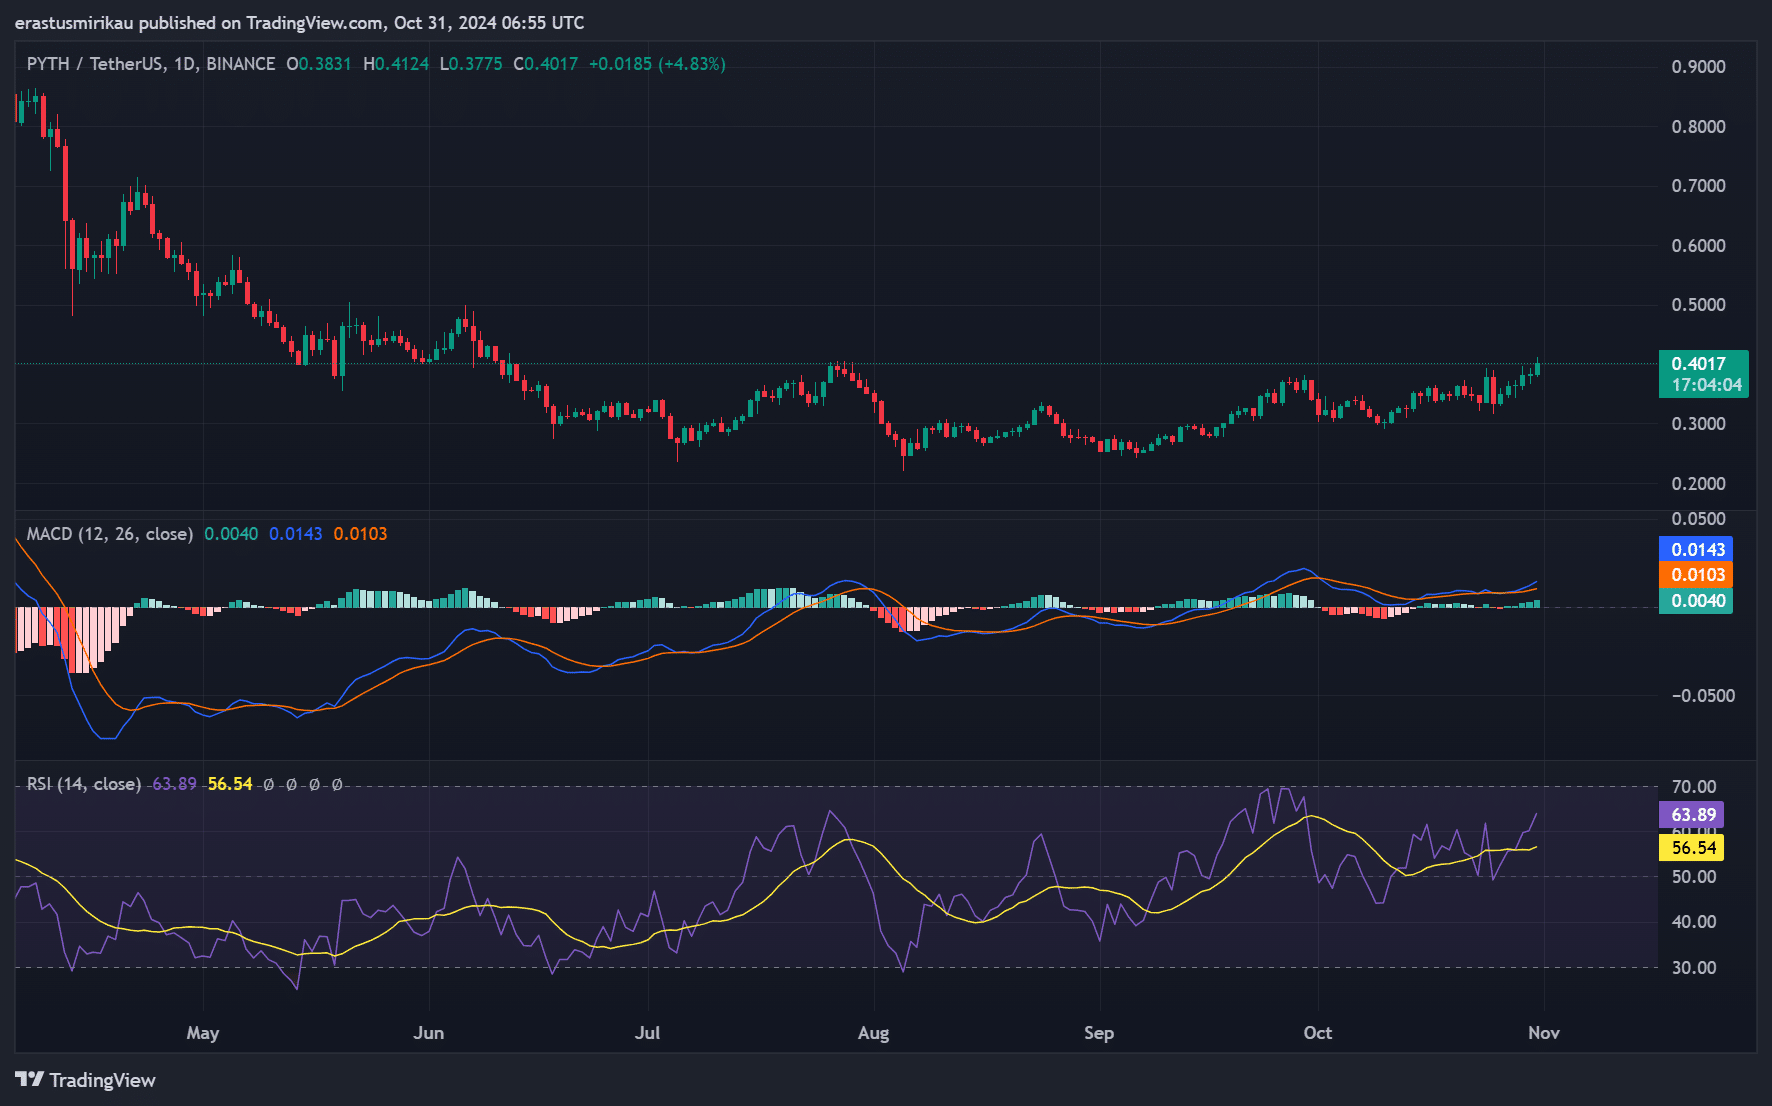
Turning to the technical indicators, the Relative Strength Index (RSI) sits at 63.89, indicating that Pyth approaches overbought territory, which could lead to a price correction. However, it retains sufficient momentum to push prices higher.
Additionally, the MACD indicator shows bullish convergence, suggesting that recent price action aligns with continued upward momentum. Both indicators provide a balanced view, indicating that while caution is necessary, the overall trend remains bullish.
Pyth’s social dominance: How does it stack up?
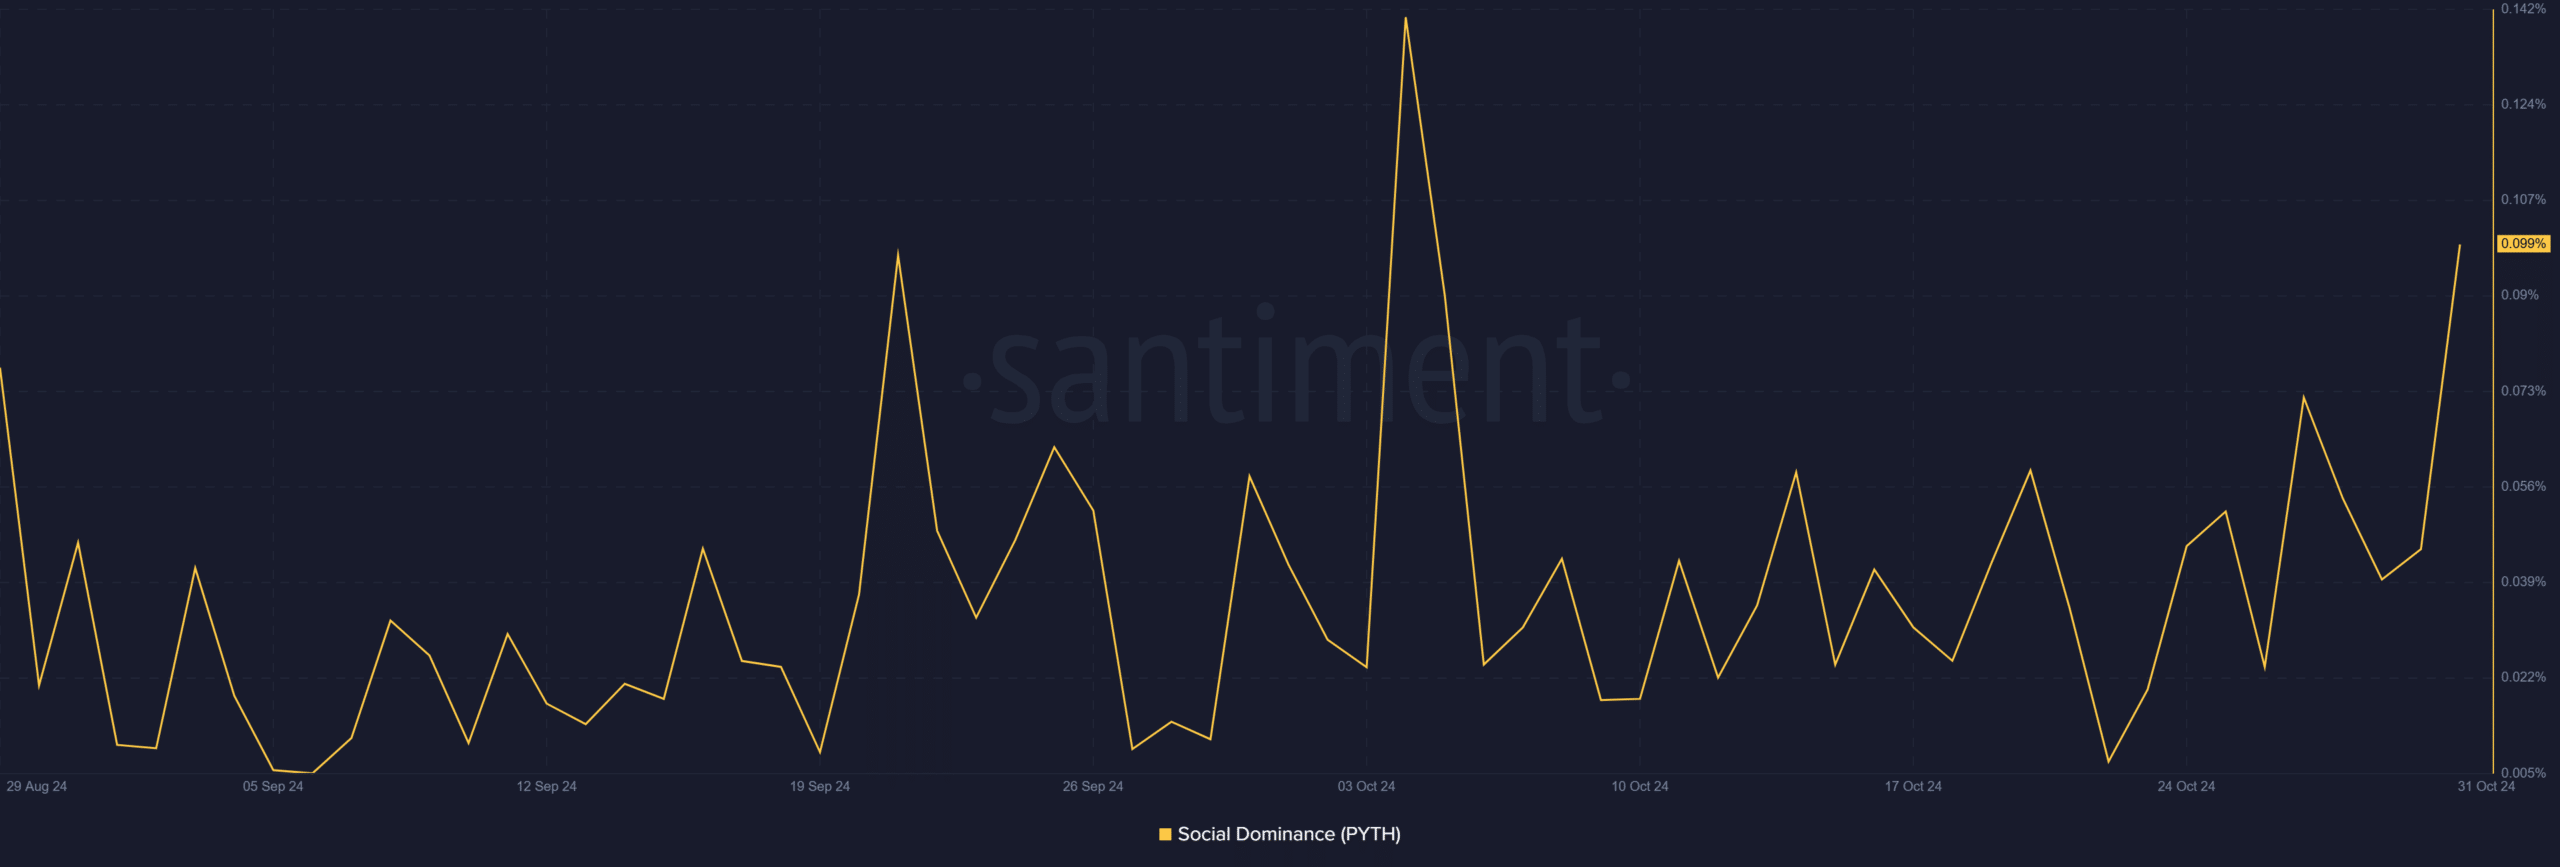
The social dominance currently sits at 0.0994%. This metric reflects increasing community interest and engagement, which proves crucial for driving future price action.
Higher social dominance often correlates with increased trading volume, reinforcing Pyth’s position in the market. Therefore, as engagement continues to rise, it may attract more investors looking to capitalize on its recent momentum.
Market sentiment: Is the open interest growing?
The open interest surged by 30.77%, reaching $66.39 million. This increase in open interest indicates that traders remain bullish on the price action, likely positioning themselves for potential gains.
Consequently, rising open interest typically indicates that more traders are entering the market, enhancing price stability and growth.
Realistic or not, here’s PYTH market cap in BTC’s terms
PYTH poised for a significant upward trajectory
Pyth Network’s recent achievements and technical indicators suggest a strong bullish trend ahead. With significant increases in transaction volume, a breakout from its ascending channel, and rising social dominance, it is well-positioned for further price appreciation.
Therefore, traders and investors should monitor Pyth closely as it aims to break key resistance levels, which could solidify its standing as a leading Oracle provider.


