TIA’s breakout – A bullish uptrend could be on the cards IF…
11/04/2024 13:00
The Celestia [TIA] token recently made an impressive move, breaking out of a falling wedge pattern in the H4 timeframe. Such a breakout...

- TIA’s breakout from a falling wedge pattern pointed to bullish momentum
- Social dominance and favorable liquidation trends supported TIA’s potential for a strong rally
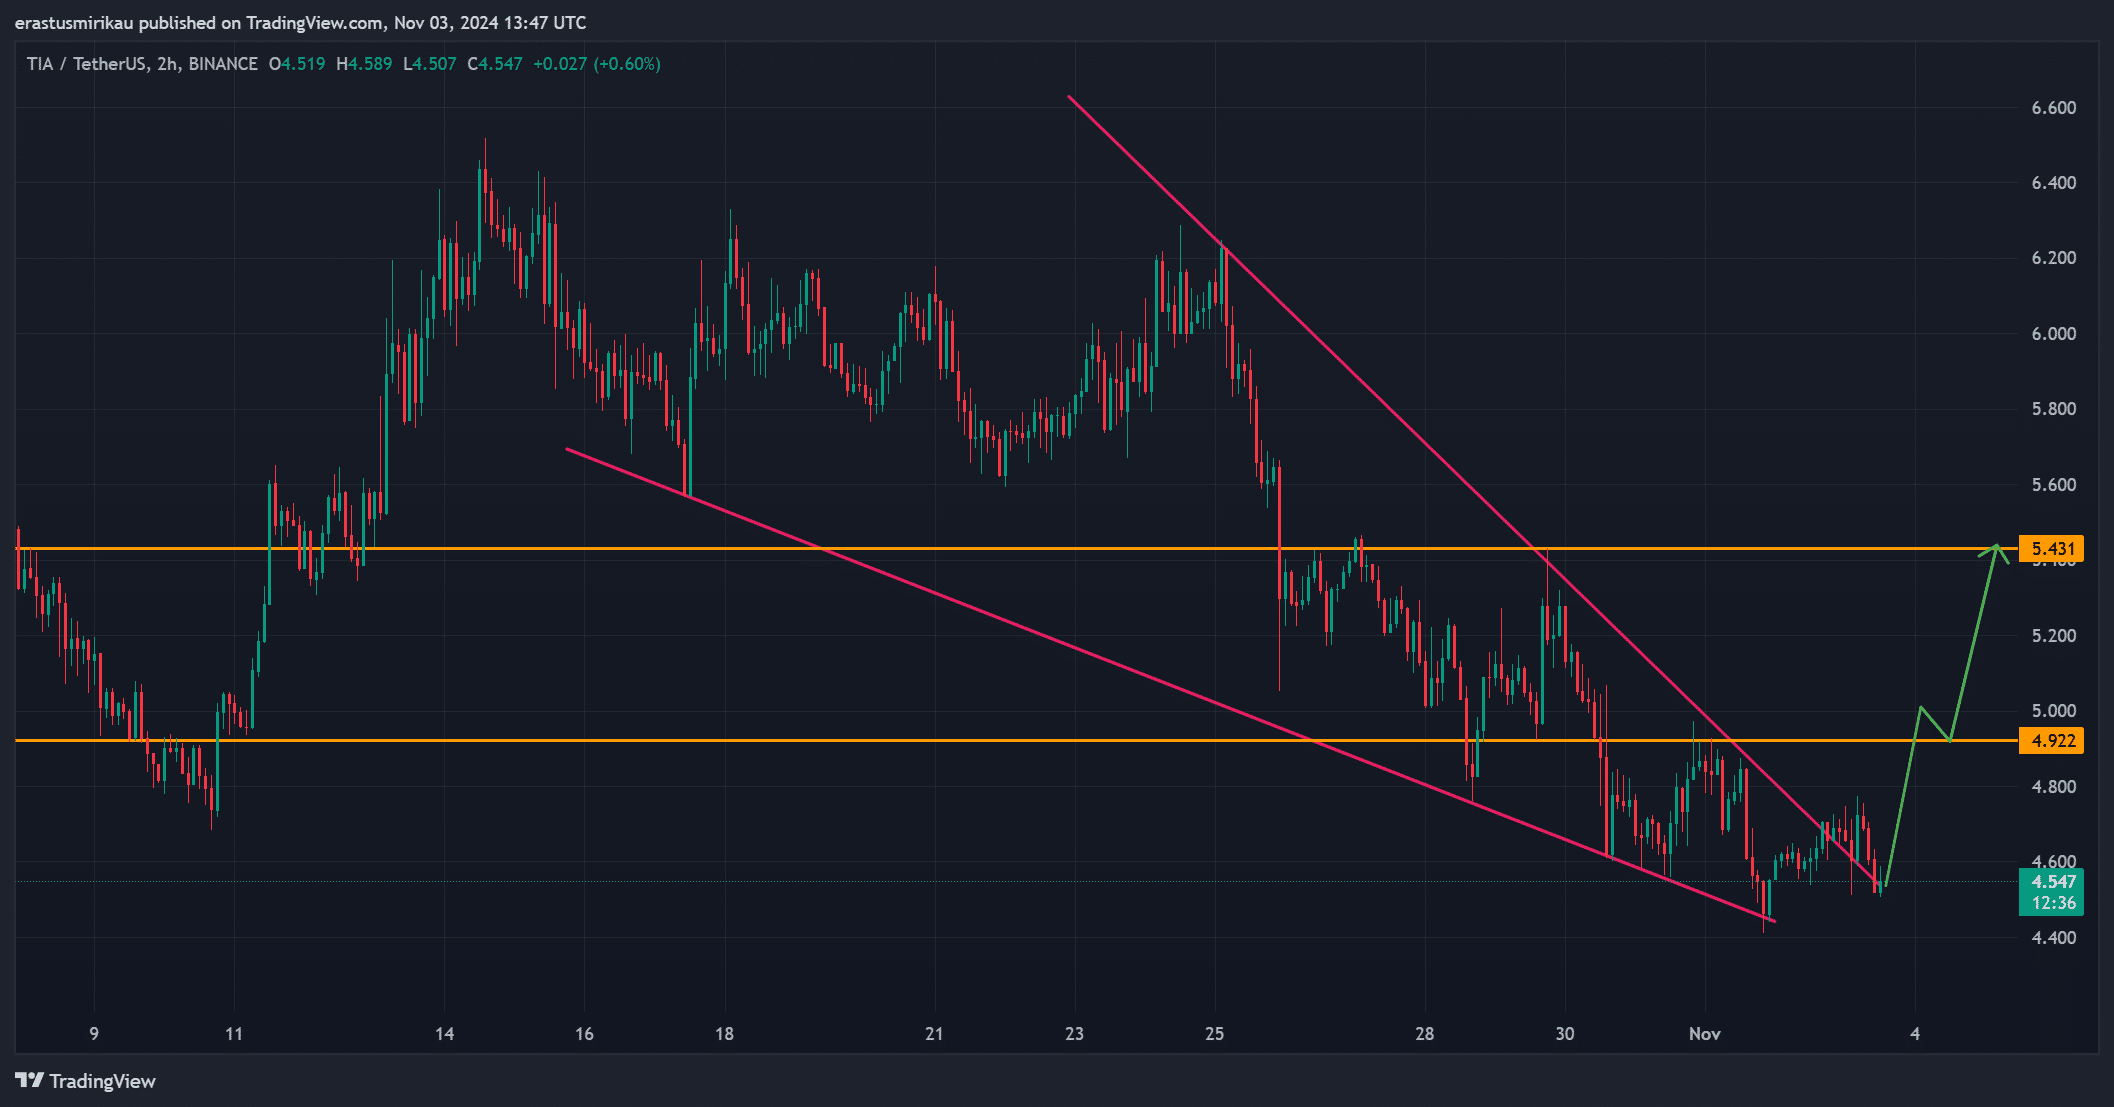
The Celestia [TIA] token recently made an impressive move, breaking out of a falling wedge pattern in the H4 timeframe. Such a breakout often suggests a bullish reversal, and Celestia’s setup seemed to capture some attention too.
At press time, TIA was trading at $4.54, down 1.31% over the last 24 hours. However, this slight dip may be temporary, as other signals indicated a potential shift towards upward momentum.
TIA’s chart hints at bullish potential
A falling wedge breakout can be a strong bullish indicator, and Celestia’s recent chart suggested exactly that. At press time, the token faced a crucial resistance around $4.92 – A level that has previously capped upward movements. Therefore, surpassing this first barrier could fuel further buying pressure, with the next significant resistance zone around $5.43.
Breaking through this level may open the door for a significant rally, as it could ignite greater investor interest. Consequently, traders are keeping a close watch on Celestia’s movements around these levels.
Rising social dominance adds momentum
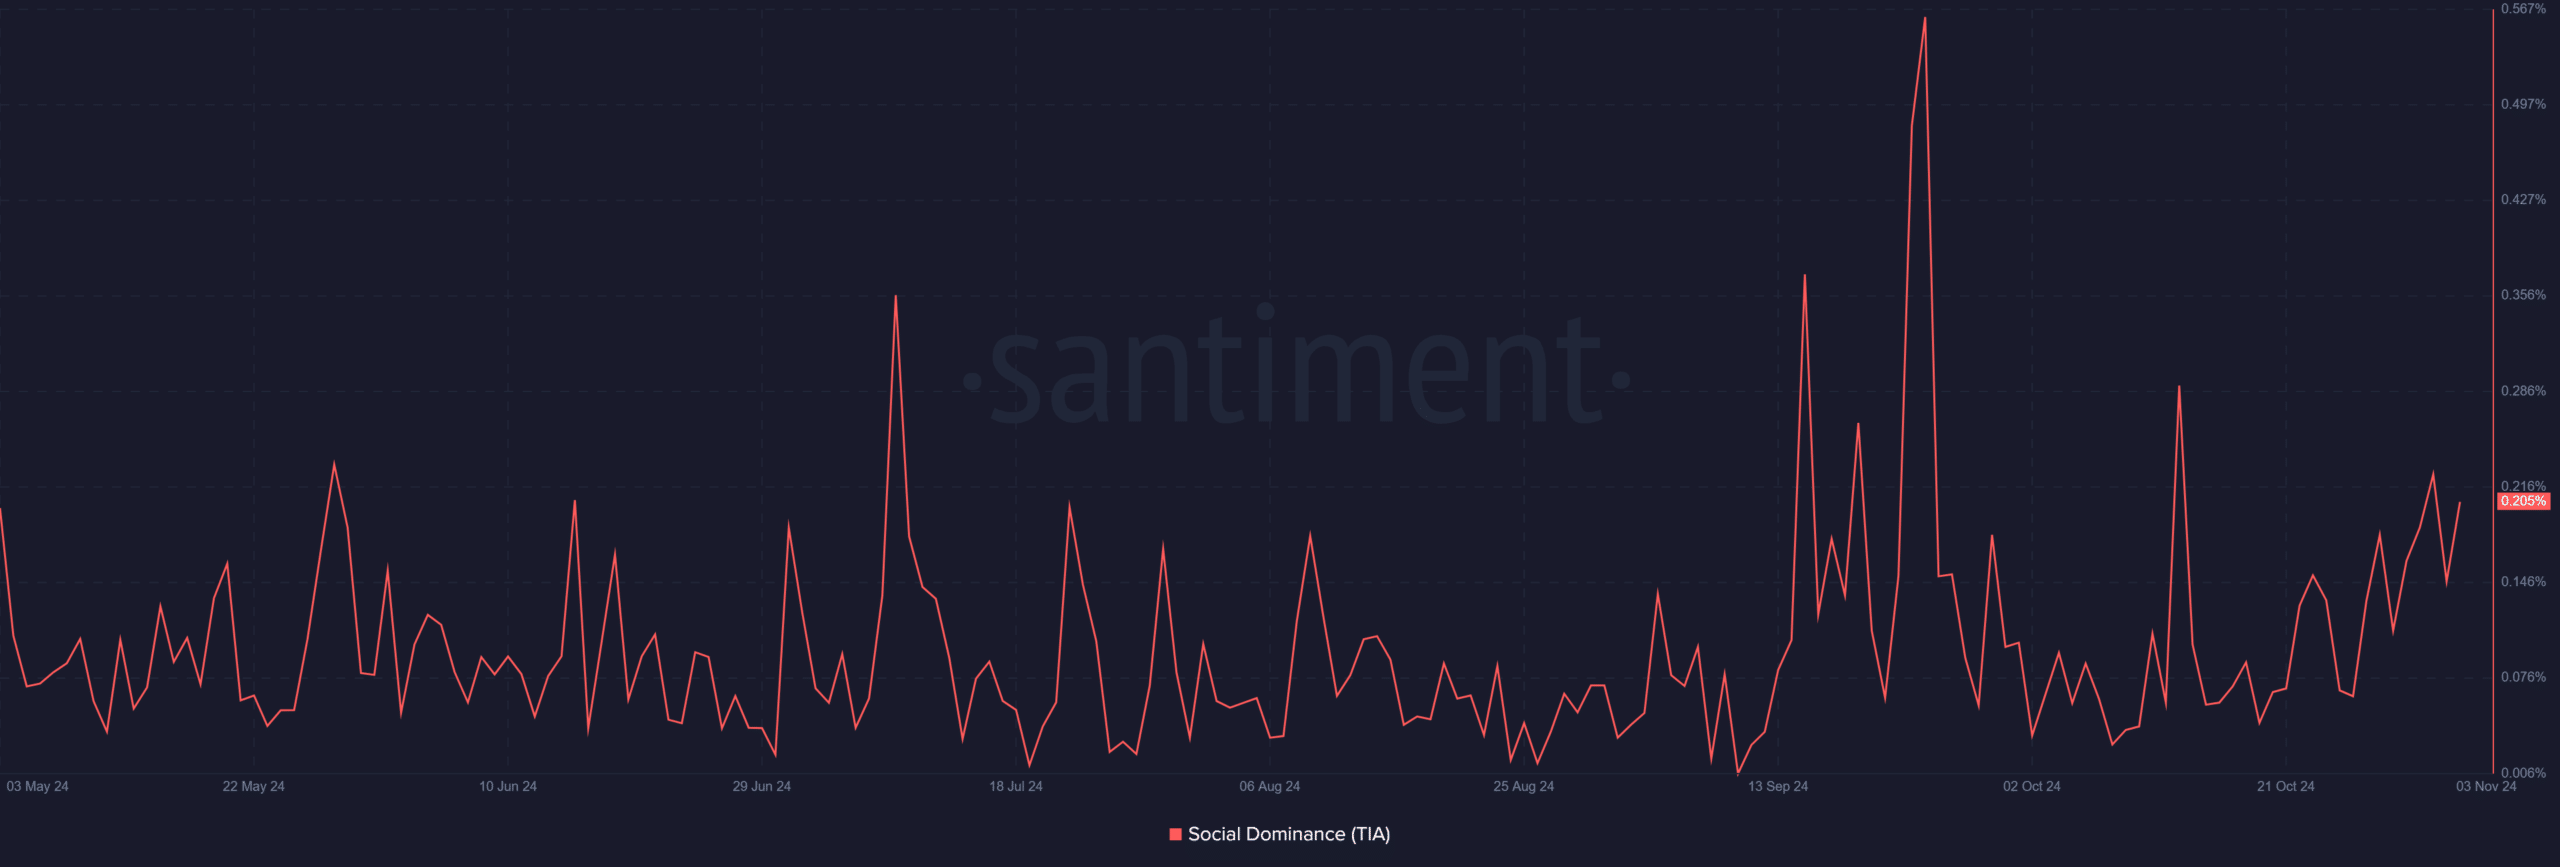
Additionally, social metrics revealed increasing interest in TIA, which could further support its price action. Recent data indicated that TIA’s social dominance rose to 0.205%, highlighting growing attention within the crypto community.
Such a spike in social activity often correlates with higher trading volume and investor enthusiasm.
Consequently, a surge in social sentiment could attract new buyers and enhance the token’s upward momentum. Therefore, the combination of technical breakout signals and heightened community interest might align well for Celestia’s short-term outlook.
Liquidation data signals bullish sentiment
Furthermore, liquidation trends revealed favorable conditions for TIA. At press time, long positions outnumbered short liquidations, with $1.87 million in longs versus $262.47k in shorts across exchanges such as Binance, OKX, and Bybit. This imbalance implied that more traders have been positioning themselves for a potential move upwards.
Additionally, the relatively lower level of short liquidations indicated that bearish sentiment may be easing. Therefore, with bullish positions dominating, the potential for upward pressure on TIA’s price appeared to be stronger, especially if demand continues to rise.
Can TIA conquer the $6.50 barrier?
With a strong breakout, rising social interest, and a favorable liquidation setup, TIA may be positioned for a significant move. However, the token must overcome the immediate $5.43 resistance before targeting the $6.20 – $6.50 range.
If TIA successfully breaks these levels, it could attract broader market attention, possibly setting the stage for an extended rally. Therefore, the coming days will be crucial for TIA’s price trajectory as it attempts to capitalize on this recent momentum.
Is your portfolio green? Check out the TIA Profit Calculator
Will TIA break through?
Given the technical breakout, greater social buzz, and favorable liquidation trends, TIA flashed promising signs of challenging its resistance levels. If it can decisively break above $5.43 and head towards $6.50, it may confirm a bullish trend.
However, sustained buying pressure will be essential for TIA to secure a solid uptrend and a longer-term rally.


