BRETT: After 39% surge, THIS suggests more gains ahead
11/15/2024 15:00
BRETT could see additional upside as bullish sentiment continues to build. What's ahead for the token as 2024 comes to an end?

Posted:
- BRETT has experienced significant gains, and the upward trend is likely to persist.
- Despite this optimism, technical indicators are sending mixed signals about BRETT’s near-term trajectory.
In the past week, Brett [BRETT] has jumped 63.24%, reflecting strong buying momentum.
This pressure has extended to the daily timeframe, driving a 39.38% increase and positioning the asset for possible continued growth.
Resistance level remains a challenge
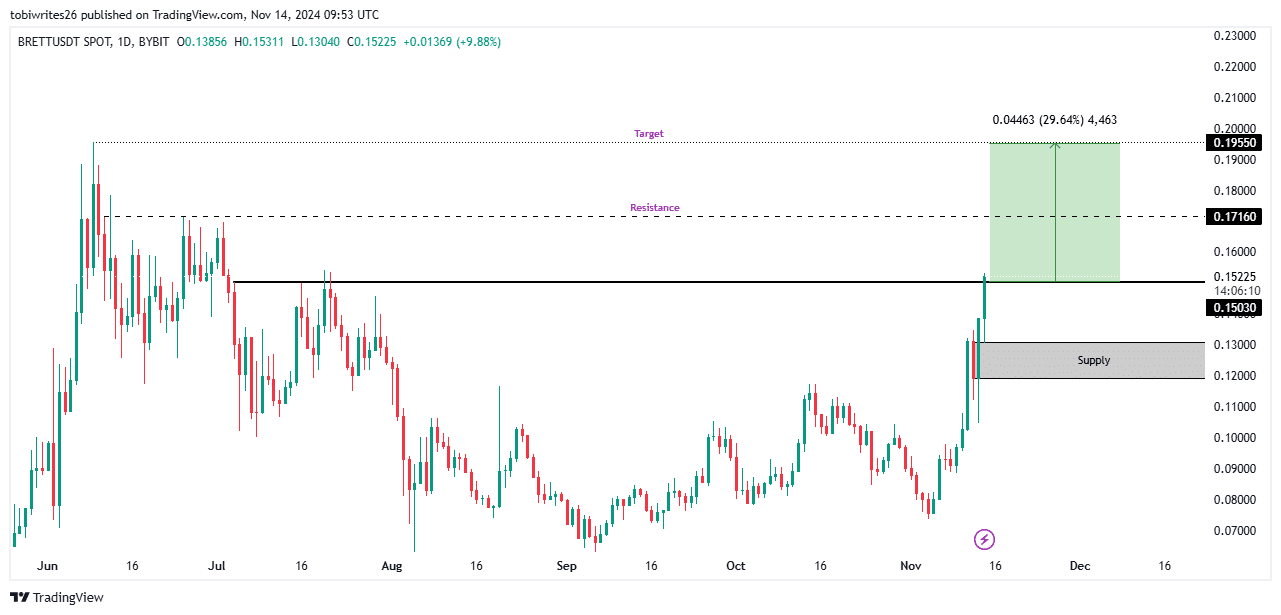
Per analysis by AMBCrypto, there was room for more upside for BRETT. Notably, it has the potential for a 29.46% gain, targeting a price of $0.19550.
However, for this rally to materialize, BRETT must clear two critical resistance levels. The first hurdle was at $0.15030, followed by $0.17160, where notable selling pressure may emerge.
If BRETT fails to break the initial resistance at $0.15030, it could retreat to the demand zones between $0.13474 and $0.11912.
At this level, the asset may either find temporary support before a further decline or encounter sufficient buying pressure to fuel a continued move upward.
BRETT targets $0.195
On-chain activity and market participant behavior suggested a bullish outlook for BRETT, with the asset potentially aiming for a $0.195 target.
As of the latest update, BRETT’s Open Interest (OI) has climbed by 58.26% to reach $72.73 million, highlighting a surge in market activity and suggesting positive sentiment around the asset.
A high OI often signals increased engagement and an influx of long positions, particularly in futures contracts, as tracked by Coinglass.
Additionally, BRETT’s long-to-short ratio remained slightly positive, with a reading of 1.0032. A ratio above 1 reflects more active long positions than short ones.
When this trend aligns with price growth—as seen in BRETT’s recent performance—it typically signals continued bullish momentum.
Overall, these metrics suggest that BRETT may be well-positioned for further gains, potentially reaching the anticipated $0.195 target.
Mixed technical indicators cloud BRETT’s rally prospects
BRETT’s recent rally shows signs of strength, yet technical indicators offer a mixed outlook on its sustainability.
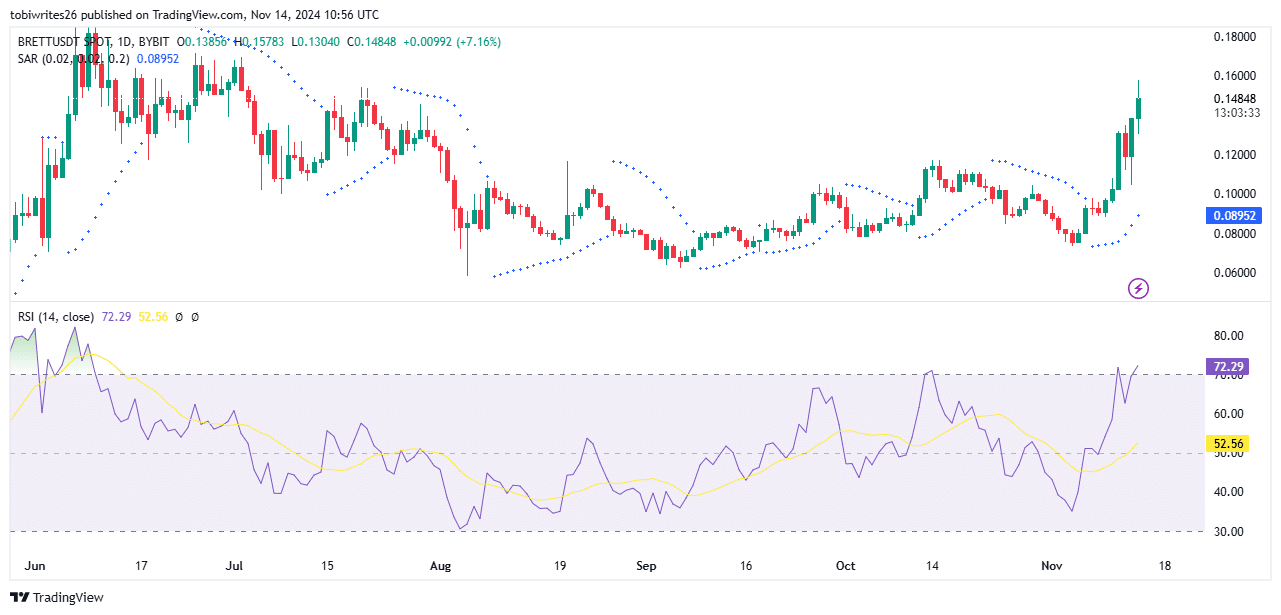
The Parabolic SAR (Stop and Reverse) indicator, which tracks market direction through dot placement relative to price, currently signals bullish momentum with dots positioned below BRETT’s price—suggesting potential for continued gains.
In contrast, the Relative Strength Index (RSI), a tool for measuring overbought (above 70) and oversold (below 30) conditions, reads 72.79 for BRETT, indicating it is overbought.
Read Brett’s [BRETT] Price Prediction 2024–2025
This elevated RSI level warns that momentum may soon wane, leaving BRETT vulnerable to a short-term pullback before any sustained upward move.
These mixed signals meant that while BRETT remained in a bullish territory, the potential for a momentum shift warranted caution.


