Bitcoin's NVT Golden Cross Points to $93,000 as Stepping Stone, Not the Top
11/16/2024 23:00
Bitcoin NVT golden cross signals further upside potential, with forecasts pointing to $100K+. Learn why BTC’s rally might continue.
The Bitcoin (BTC) Network Value to Transaction (NVT) golden cross suggests that the cryptocurrency’s recent surge past $93,000 might not mark the peak of this cycle. BeInCrypto observed this after analyzing the current state of the metric.
At press time, BTC trades at $90,893. Here is why this slight drawdown may not last: instead, Bitcoin’s price could rally well above its all-time high.
Data Shows that Bitcoin Remains Undervalued
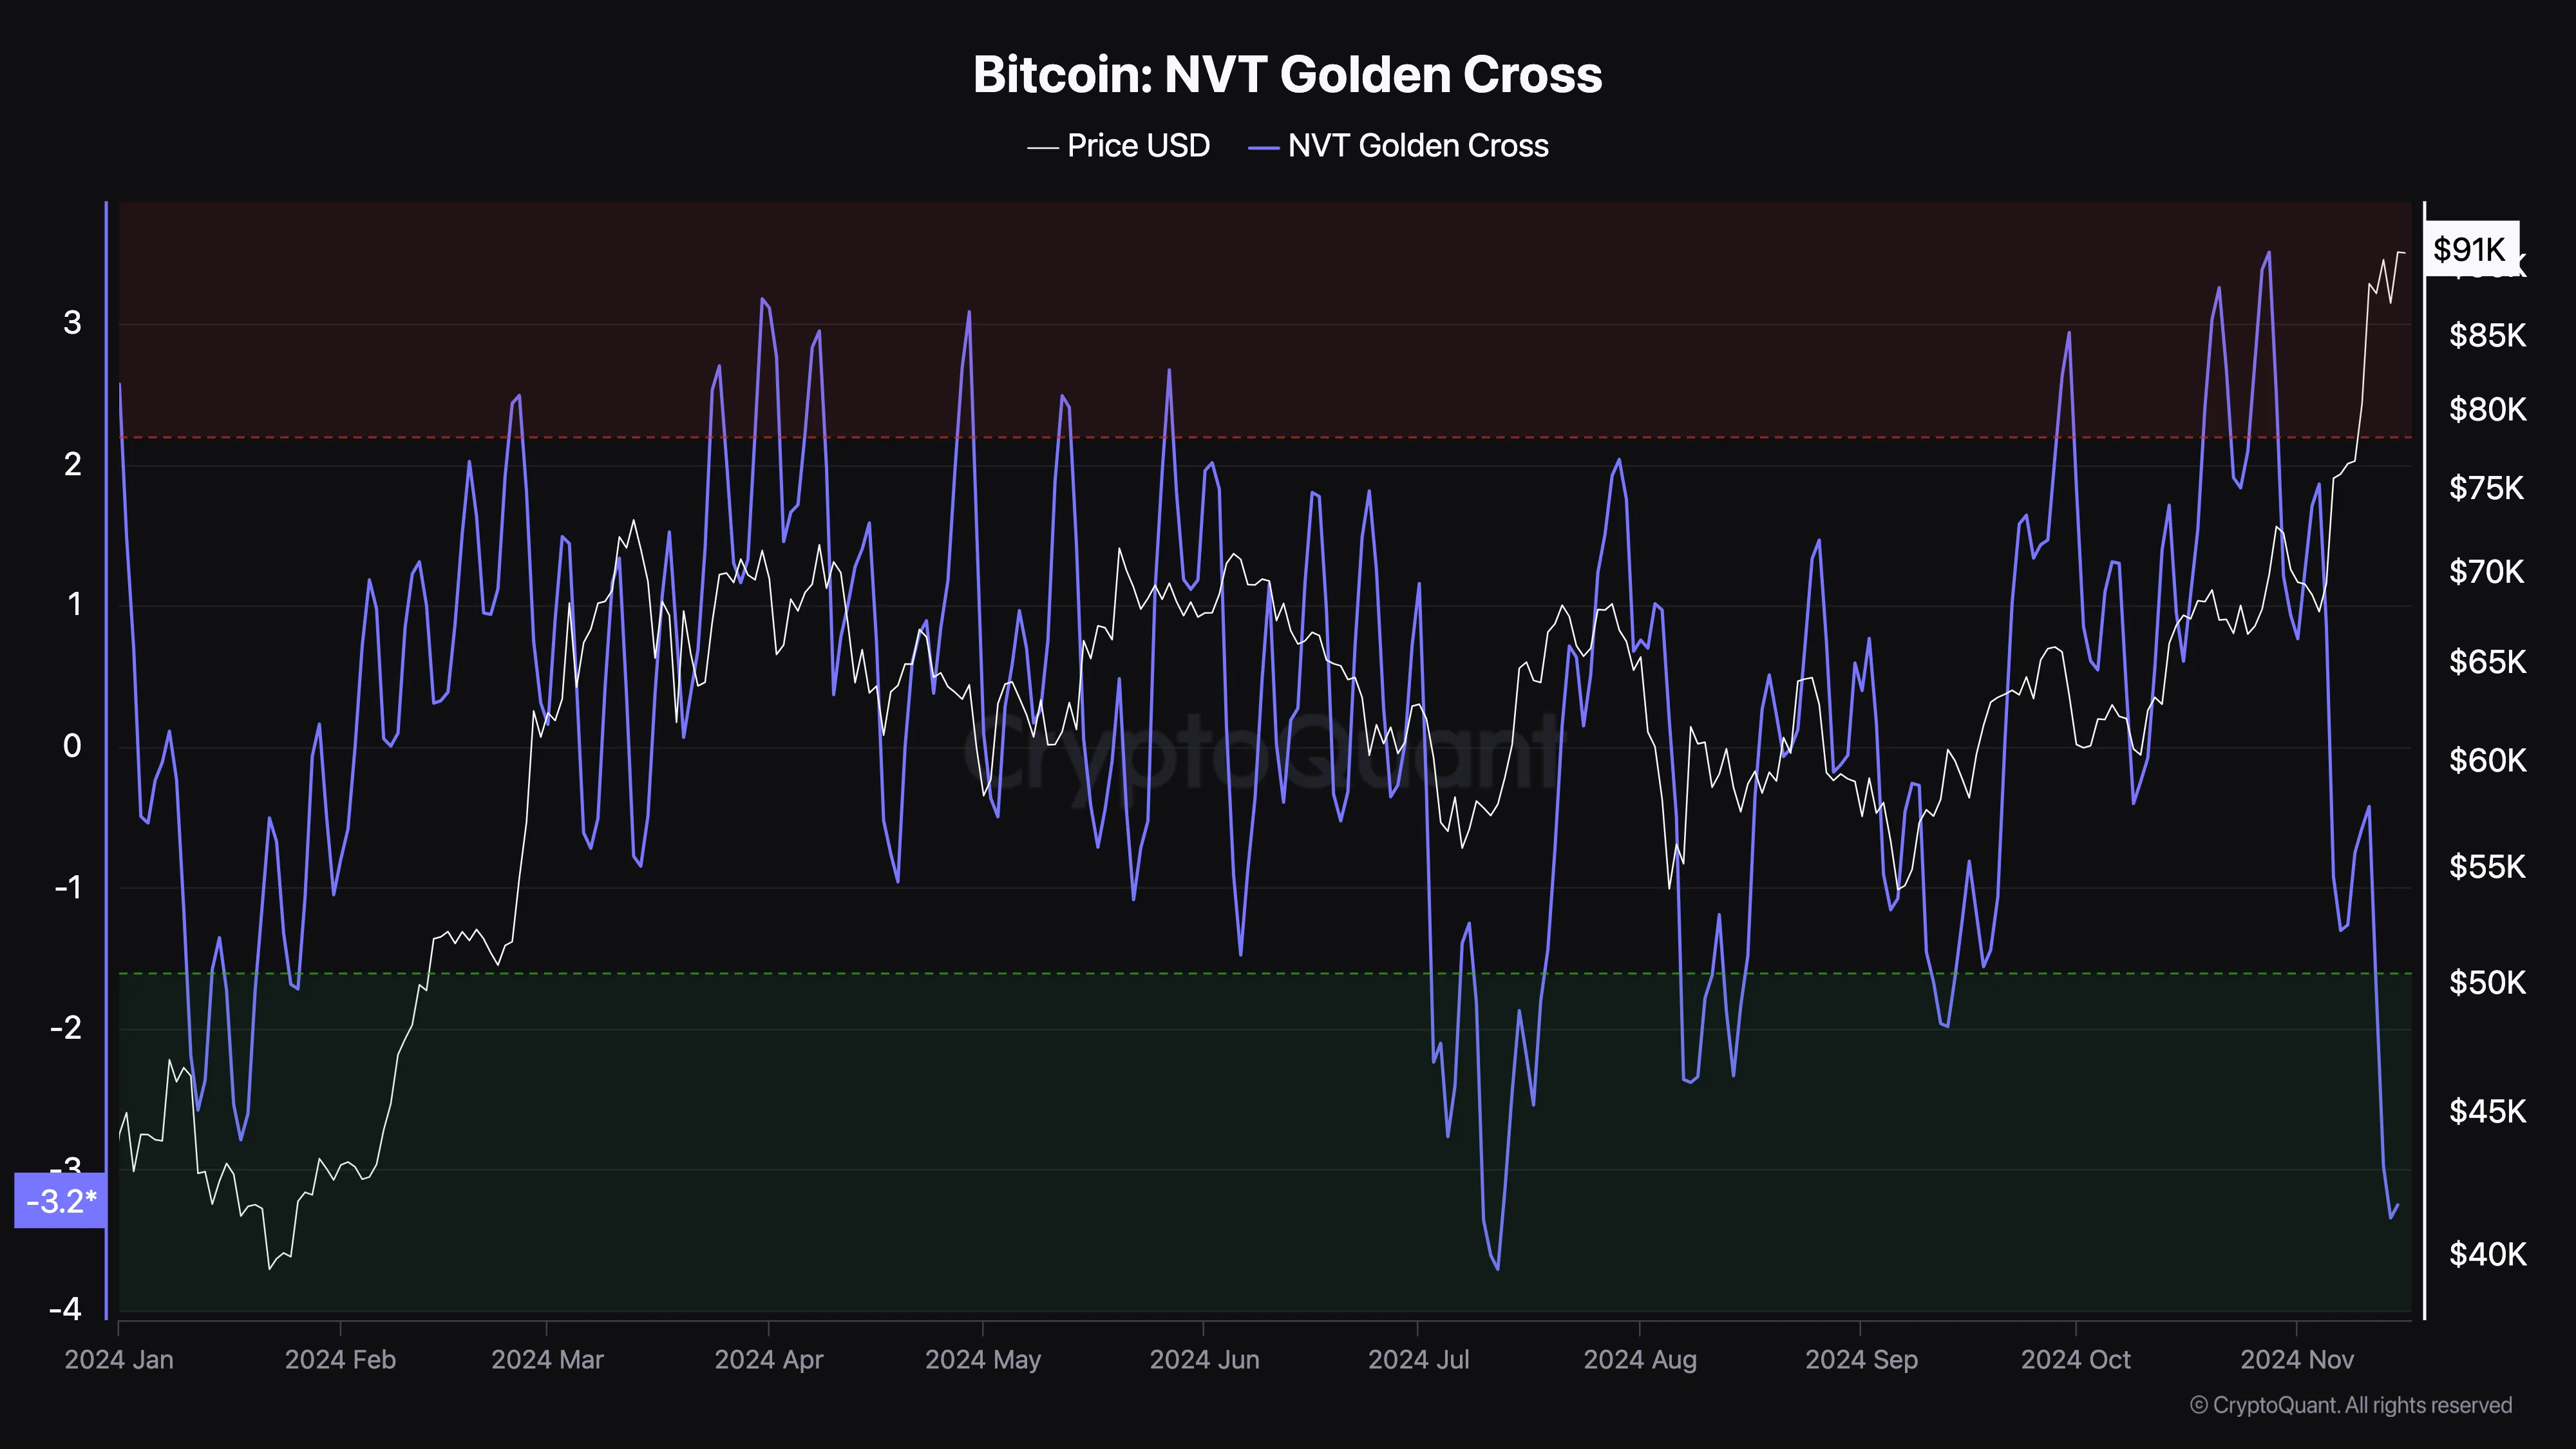
Bitcoin’s NVT golden cross is a metric that helps spot tops and buttons during a cycle. When the NVT golden cross surpasses 2.2 points (red region), it indicates a short-term trend of price overheating, potentially signaling a local top.
Conversely, a drop below -1.6 points (green area) suggests the price is cooling excessively, pointing to a possible local bottom. According to CryptoQuant, the metric’s reading is -3.25 as of this writing, suggesting that Bitcoin’s price still has room to appreciate.
For instance, when the metric was -2.60 in January, BTC traded below $42,000. About two months later, the coin went on to hit $73,000. Therefore, considering historical data and the current position of the metric, it is likely for BTC to climb toward $100,000 before the year closes.

This outlook also aligns with that of Crypto Kaleo, an analyst. According to Kaleo, Bitcoin’s potential rise to $100,000 could bring back retail investors and possibly push the price higher.
“I think Bitcoin surprises everyone when it crosses $100K, sends straight past it and doesn’t look back. It’s been such a mental milestone for so long that it’ll bring retail FOMO back in full force when it happens,” the pseudonymous analyst wrote on X.
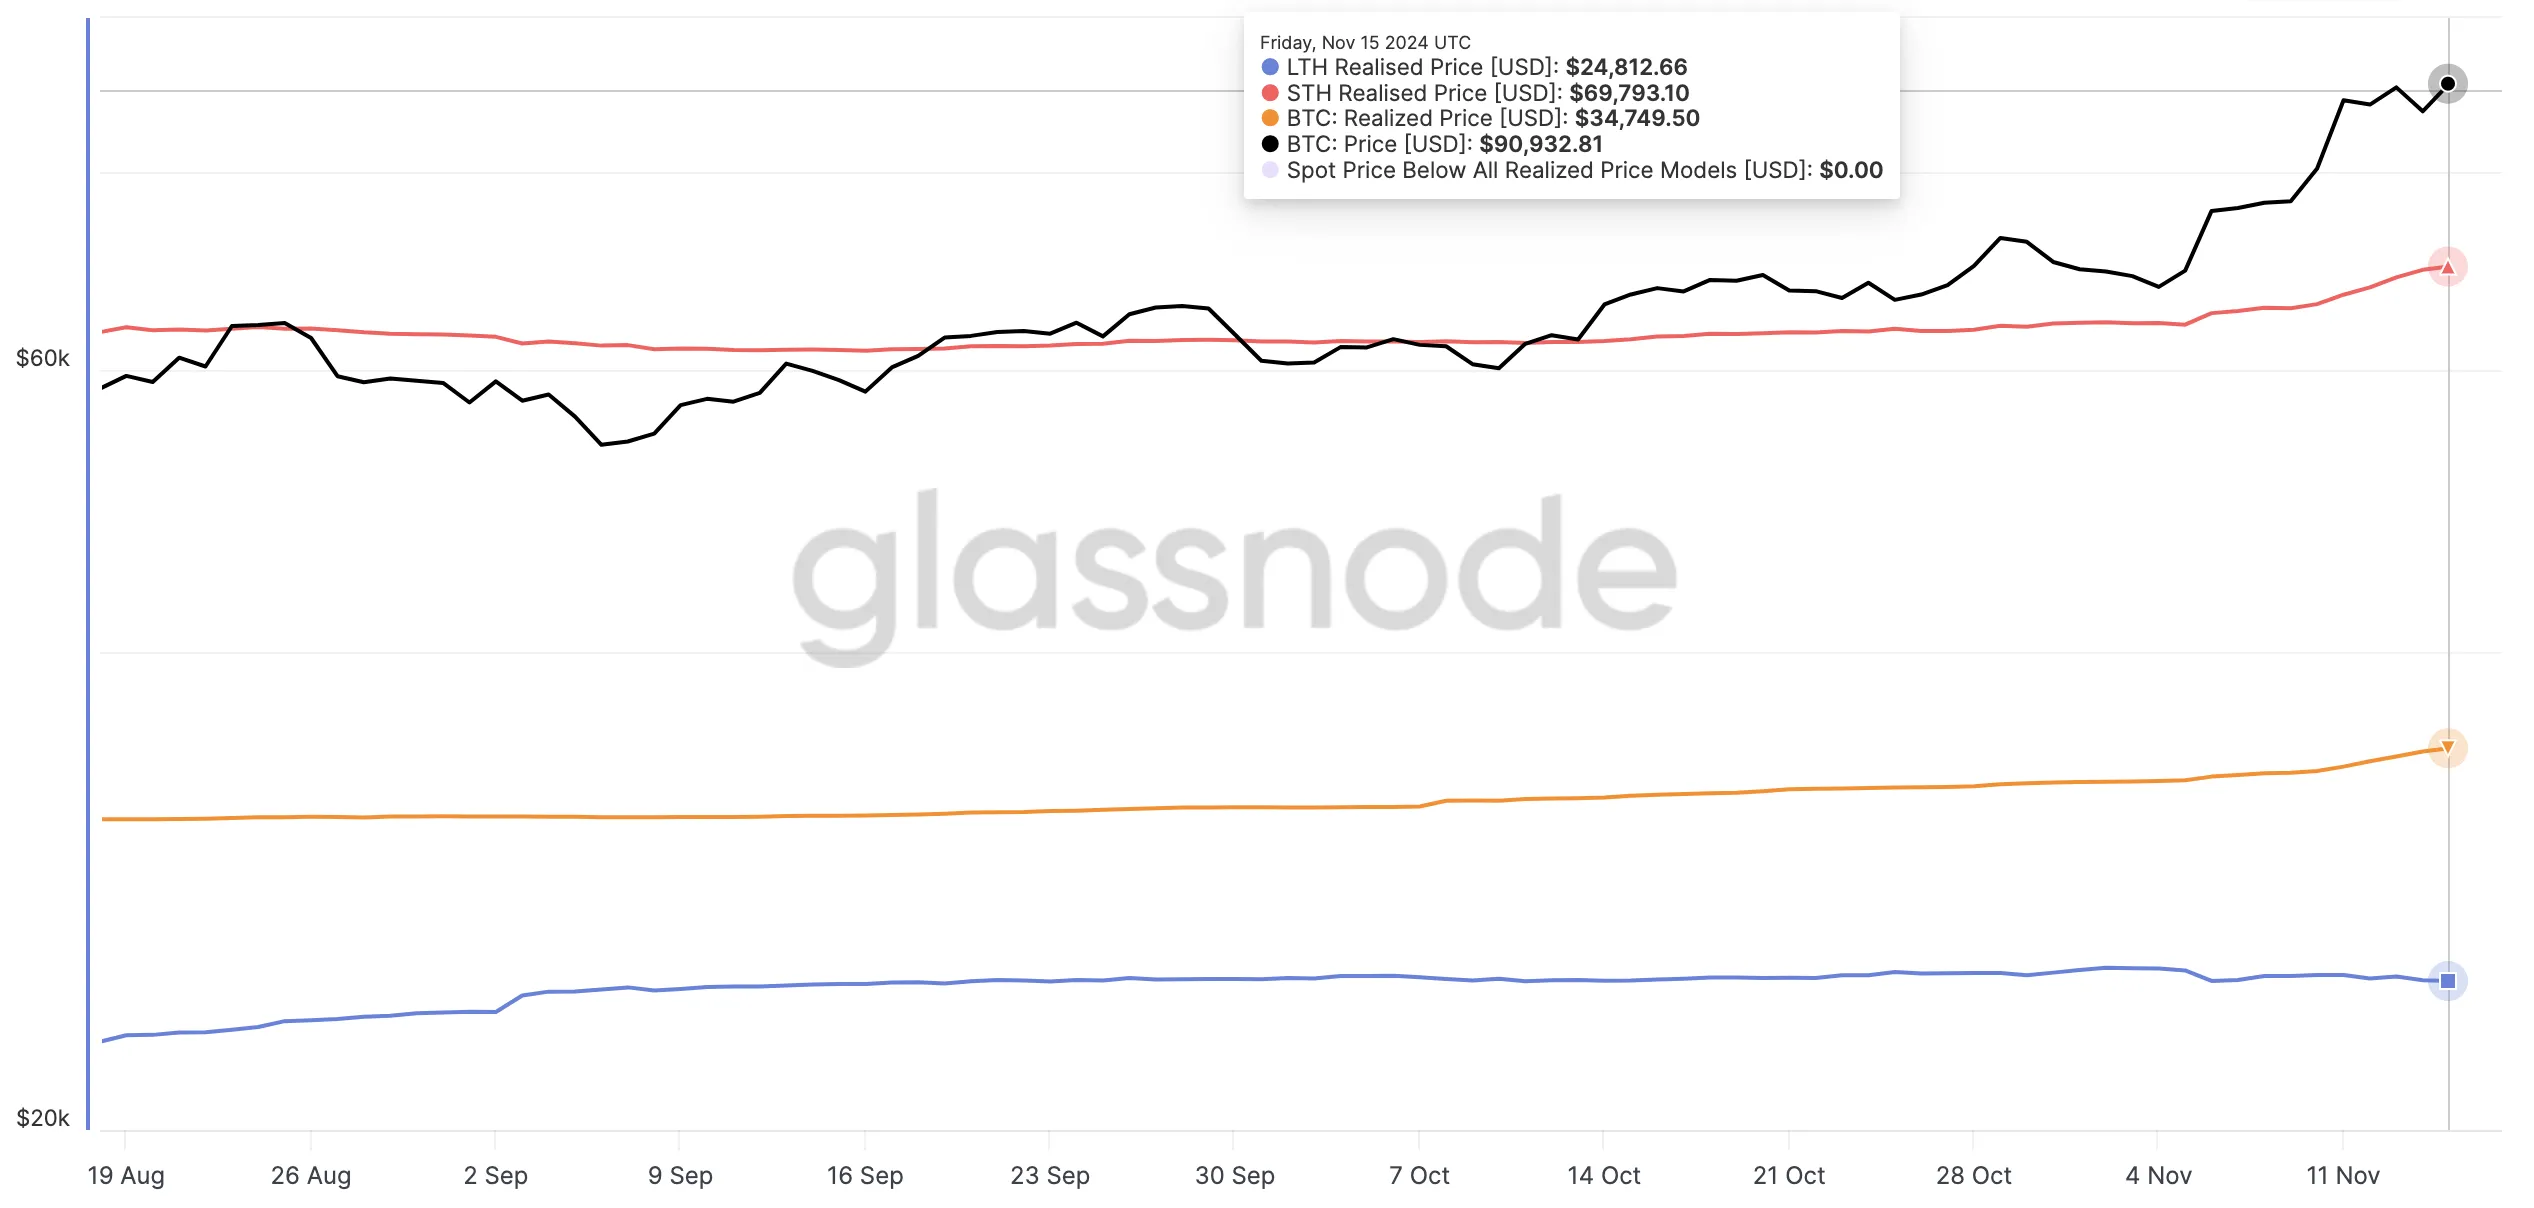
Furthermore, Glassnode data shows that Bitcoin is currently trading above the realized price of Short-Term Holders (STH) and Long-Term Holders (LTH). The realized price represents the supply-weighted average price that market participants paid for their coins. It serves as an on-chain indicator of potential support or resistance levels.
Typically, when the realized price is above BTC, the cryptocurrency faces resistance. Hence, the price might find it challenging to climb. However, as seen above, the STH realized price is below BTC’s value at 69,793, indicating that the price could continue to rise.

BTC Price Prediction: Could $104,000 Be Next?
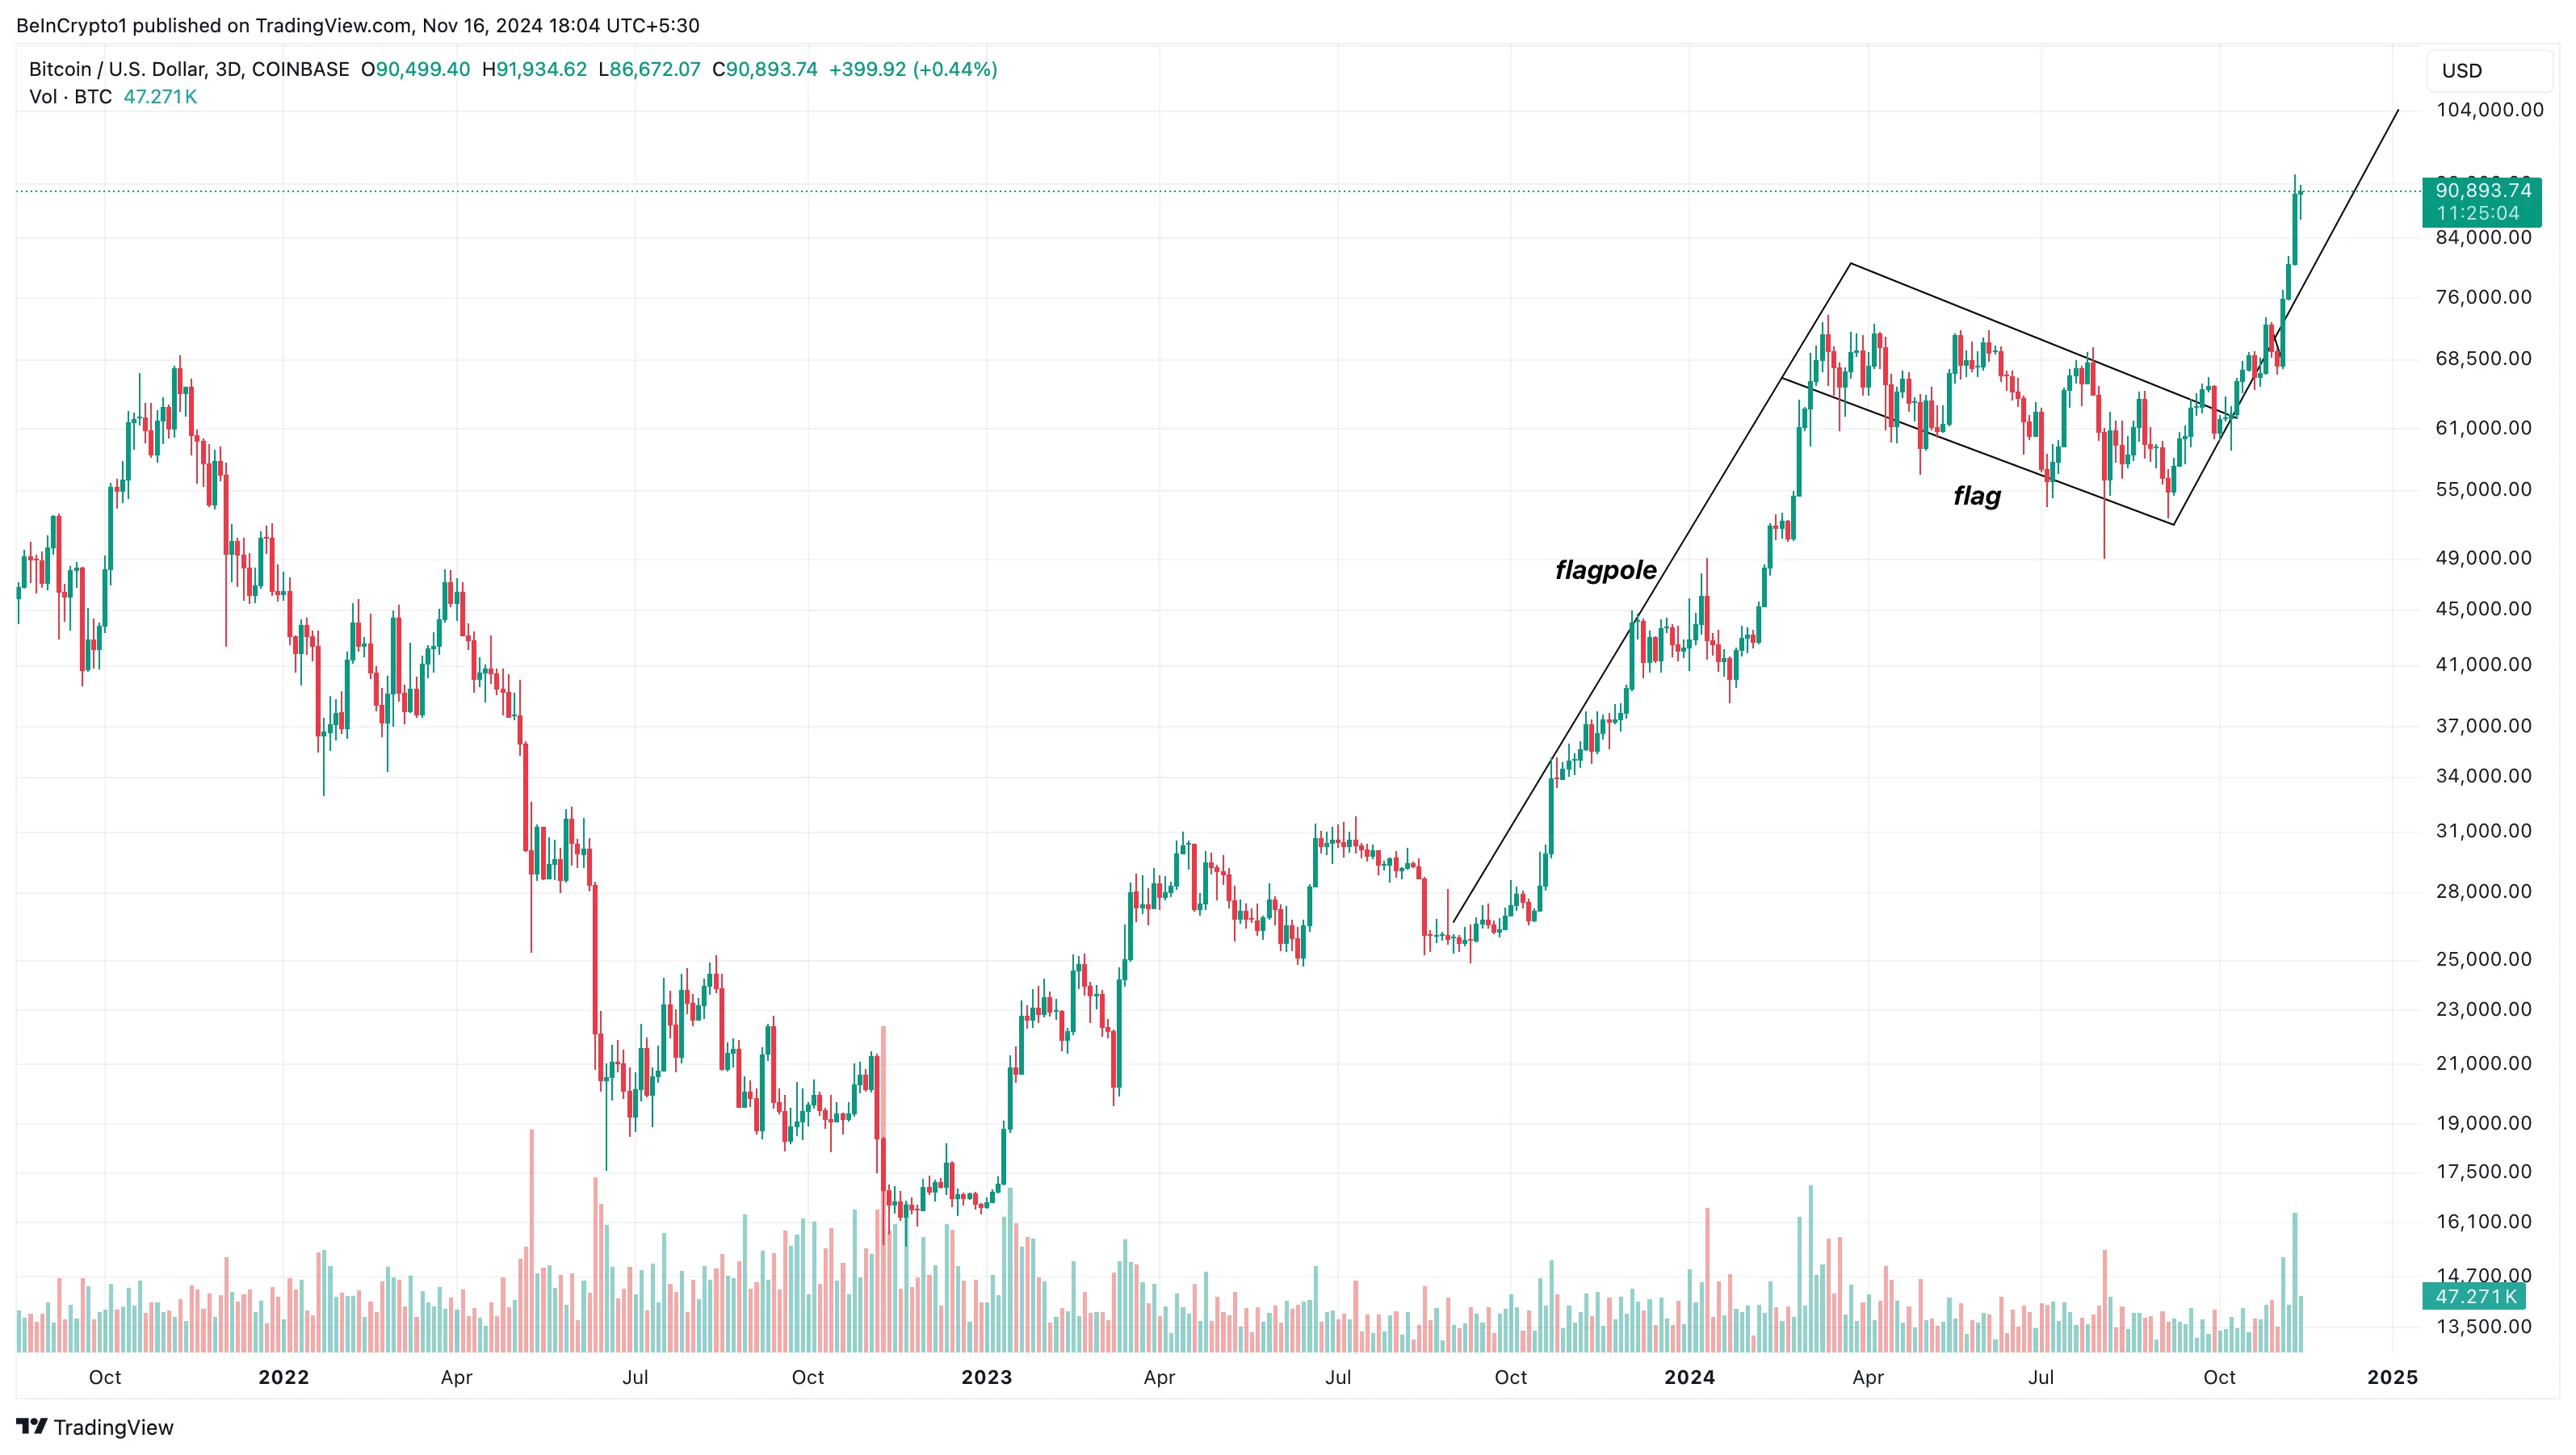
On the 3-day chart, Bitcoin has formed a bullish flag. A bull flag is a bullish chart pattern characterized by two rallies separated by a short consolidation phase. The flagpole forms during a sharp upward price spike as buyers overpower sellers.
This is followed by a retracement phase, during which price movement creates parallel upper and lower trendlines, forming the flag shape. Considering the current outlook, Bitcoin’s price could rally toward $104,228 as long as buying pressure increases.

However, if the Bitcoin NVT golden cross hits an extremely high value, that could mark a local top for BTC. In that case, the coin’s price could face a notable correction.
Disclaimer
In line with the Trust Project guidelines, this price analysis article is for informational purposes only and should not be considered financial or investment advice. BeInCrypto is committed to accurate, unbiased reporting, but market conditions are subject to change without notice. Always conduct your own research and consult with a professional before making any financial decisions. Please note that our Terms and Conditions, Privacy Policy, and Disclaimers have been updated.