Cardano price prediction shows ADA is set to surge past $1 – How?
11/20/2024 20:00
The long-term Cardano price prediction is strongly bullish and the token is set to climb past $1, but could see volatility in the coming days

Posted:
- Cardano displayed a bearish momentum divergence on the daily chart.
- The liquidation map and $0.787 resistance could lead to a minor price dip.
Cardano [ADA] was strongly bullish on the daily and weekly timeframes. The altcoin has rallied 38% over the past week and is up by 146.7% since the lows set on Monday the 4th of November.
Over the past week, Bitcoin [BTC] has rallied 5%. It could be due for a minor dip toward $90k over the weekend that traders could use to go long on Cardano.
In the long term, both Cardano and Bitcoin remain strongly bullish.
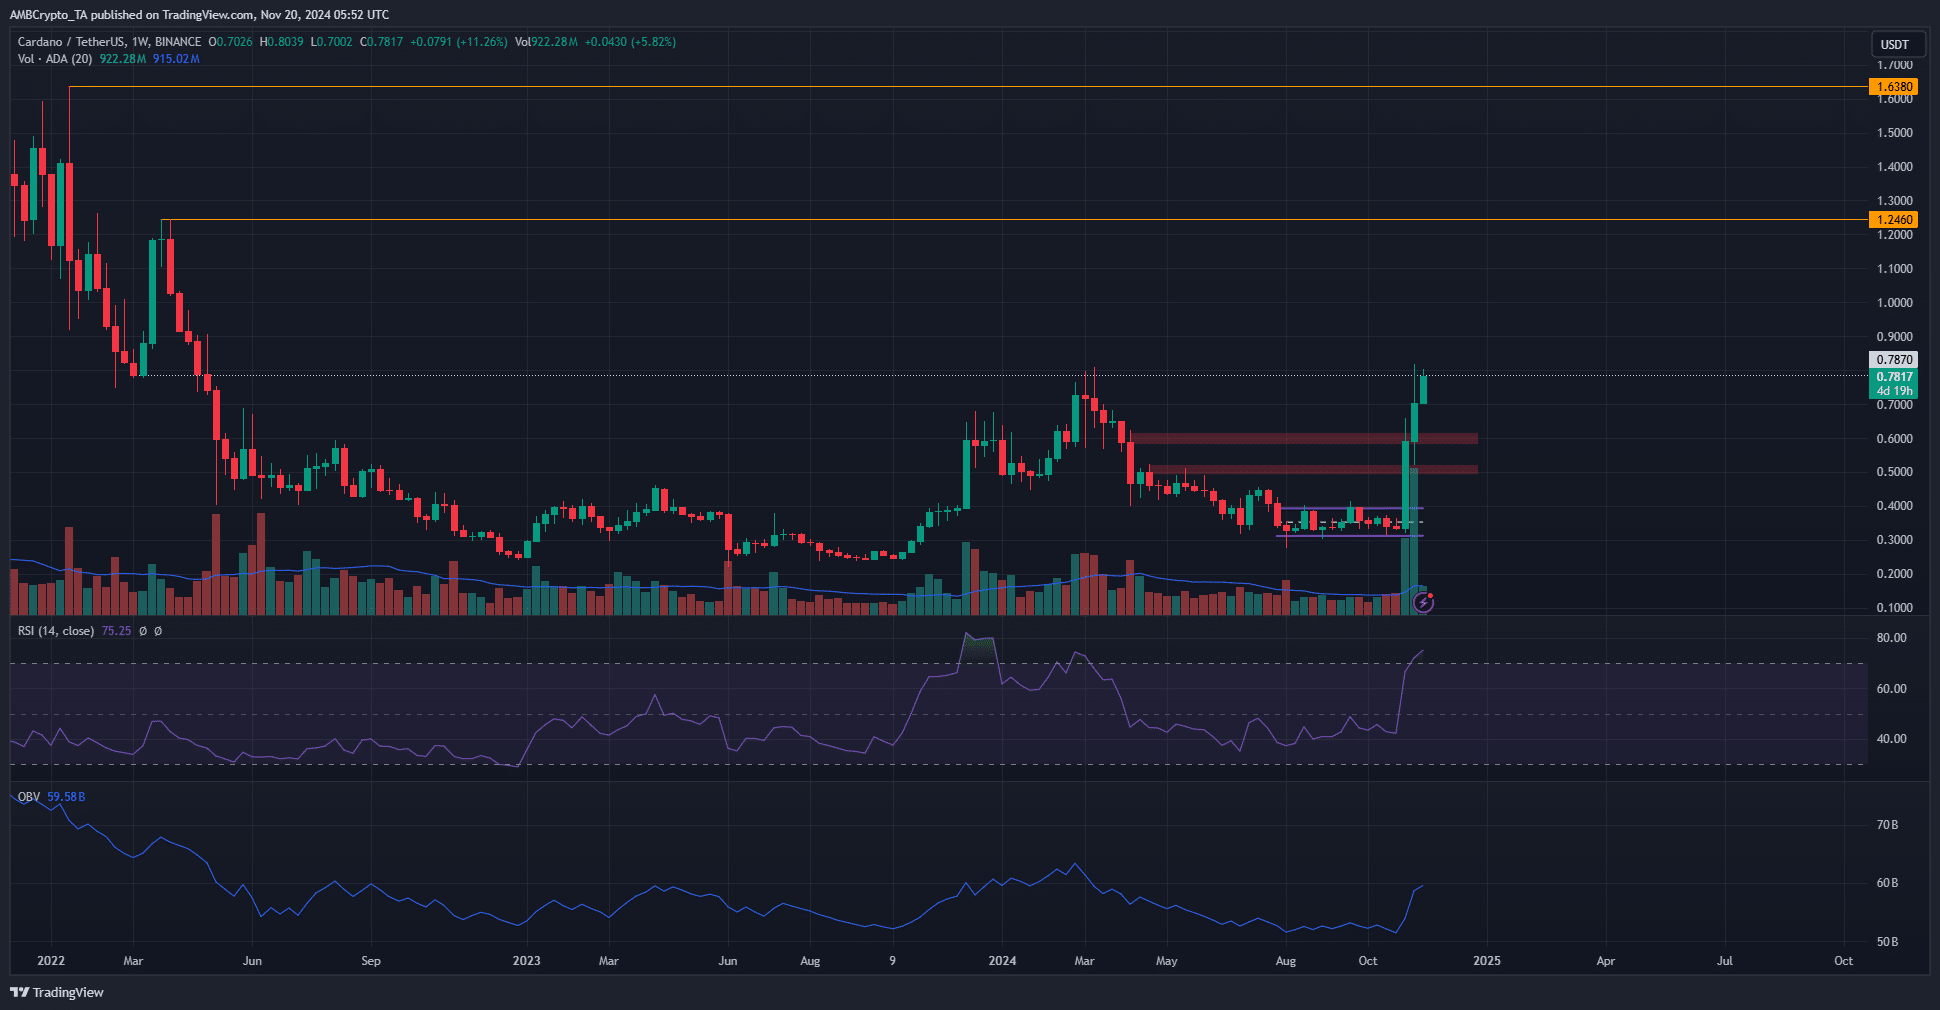
The weekly chart showed that Cardano had set a new high for 2024 last week. At press time, it appeared set to continue to uptrend.
The $0.6 zone, which was expected to serve as resistance, forced a minor rejection on the 11th of November. It was overcome a few days later, and Cardano was able to rally to $0.819.
On the weekly chart, the RSI was at 79.25 to indicate intense upward momentum. A bearish divergence was not seen on the weekly chart but has formed on the daily chart.
This was a concern as Cardano bulls fought to reclaim the $0.787 level as support.
A minor dip to $0.705 was possible. Meanwhile, the OBV has been rising swiftly in November to reflect increased demand for the token.
More reasons for ADA’s dip
The 30-day liquidation map revealed that many long liquidation levels were present in the $0.741-$0.781 region.
A price dip into this area can sweep a sizeable quantity of liquidation levels and could potentially lead to a deeper slump toward $0.726.
Read Cardano’s [ADA] Price Prediction 2024-25
This idea has confluence with the RSI bearish divergence on the daily chart and the price trading below the key resistance level at $0.787.
Such a dip would offer buyers another opportunity to go long and could be a healthy outcome in the coming days.
Disclaimer: The information presented does not constitute financial, investment, trading, or other types of advice and is solely the writer’s opinion.
