Ethereum’s next big move: Is $3,900 on the horizon if $3,600 breaks?
11/29/2024 17:00
Ethereum [ETH] recently managed to hit the $3.6k mark, thanks to the weekly price pump, but it fell under that mark.

Posted:
- ETH witnessed a slight rise in selling pressure as most investors were “in money.”
- Technical indicators suggested a breakout above the $3.6k resistance.
Ethereum [ETH] recently managed to hit the $3.6k mark, thanks to the weekly price pump. This pump allowed a substantial chunk of ETH addresses to be in profit. However, it witnessed a slight pullback in the past 24 hours. Will this trend last or, will ETH reverse and move towards $3,900 next?
Ethereum faces correction
AMBCrypto reported earlier the event of ETH touching its resistance at $3.6k. If ETH turned that resistance into support, it could next target $3.9k. However, that didn’t happen as at press time it was trading at $3,577.87.
Meanwhile, IntoTheBlock’s data revealed that over 90% of ETH investors were “in money”. Generally, whenever such massive number of investors get in profit, it results in profit taking activity, causing a rise in selling pressure.
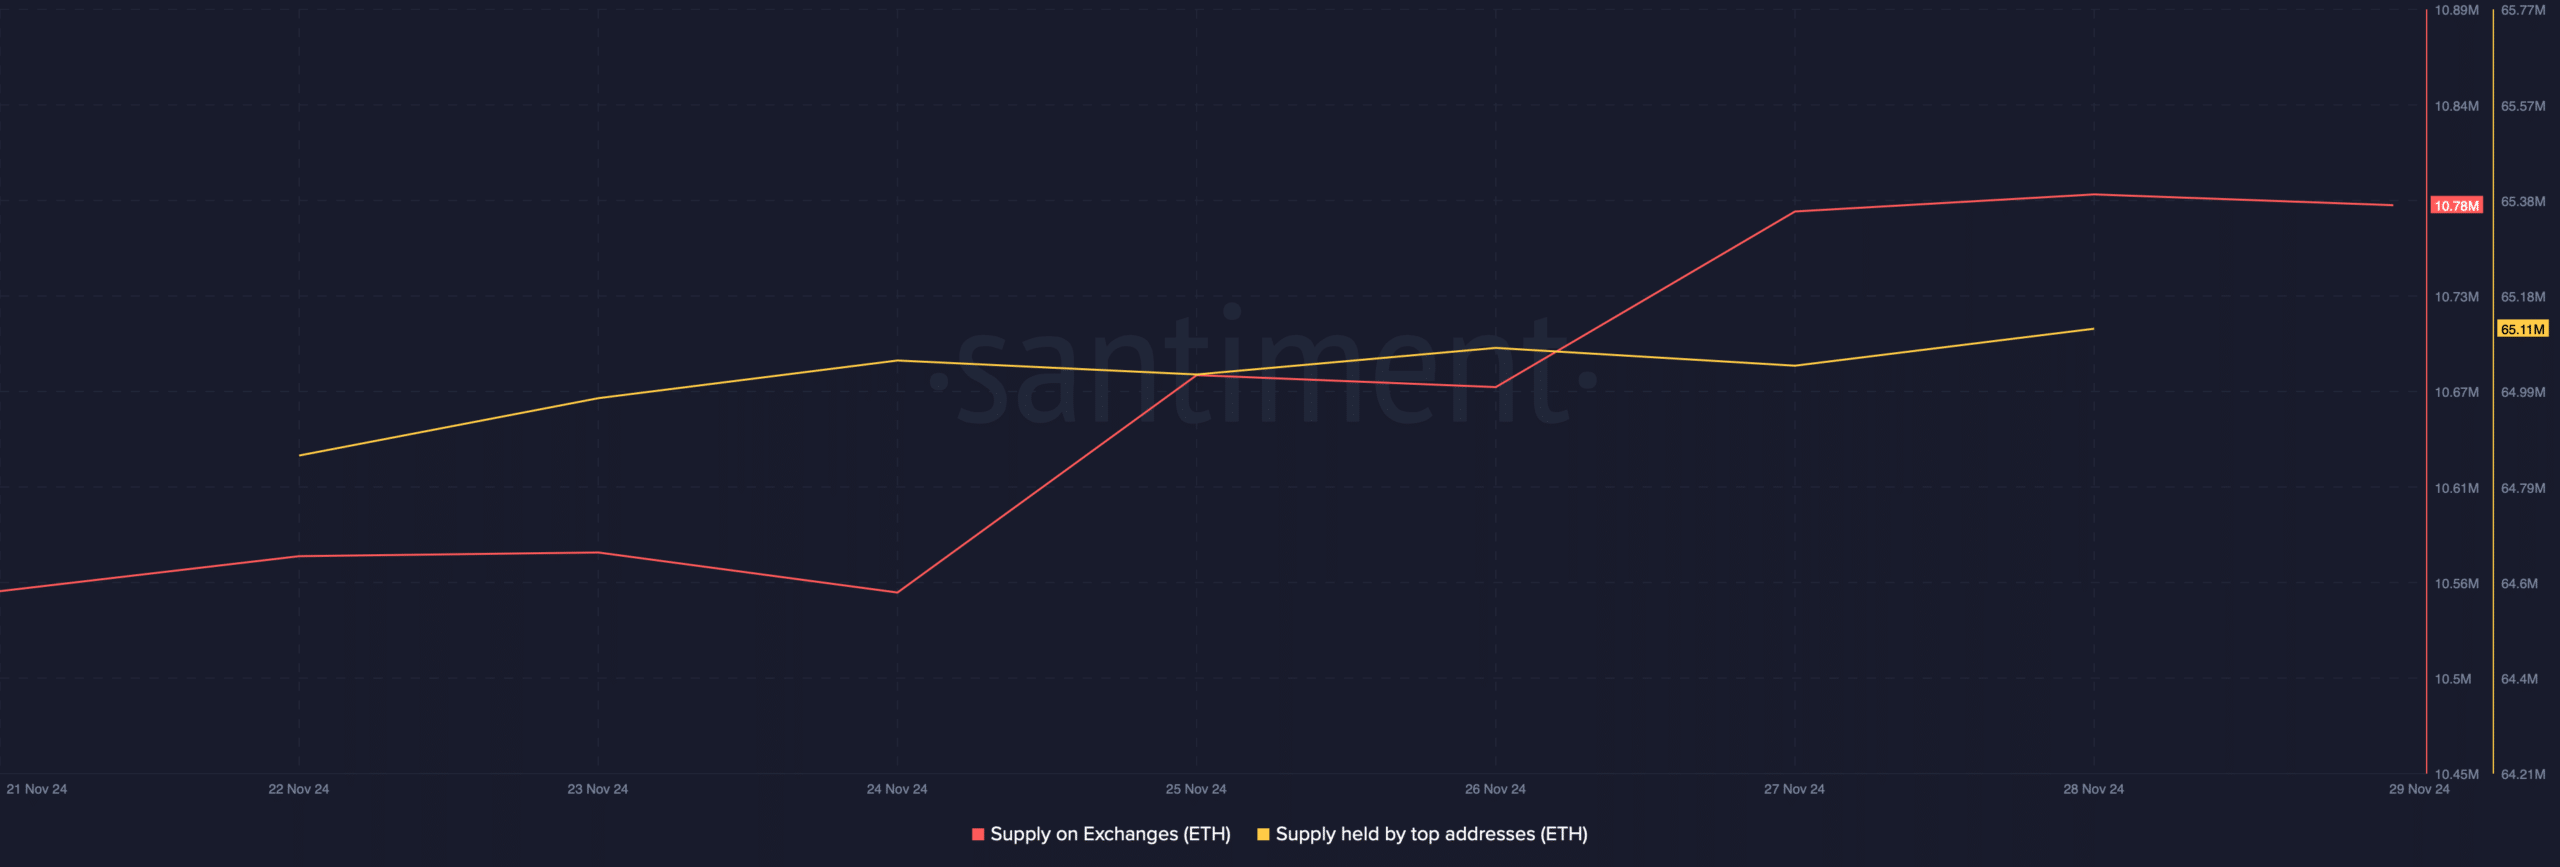
In fact, that seemed to be happening on this occasion. As per Santiment’s data, ETH’s supply on exchanges registered an uptick, indicating that investors were selling their holdings.
Nonetheless, whales were showing confidence in Ethereum, as evident from the rise in its supply held by top addresses.
Will ETH’s downtrend continue?
To find whether whale confidence be enough to propel ETH above $3.6k towards $3.9k, we checked other datasets. Ethereum’s open interest increased sharply last week while its price surged.
This suggested that the latest correction might be short-lived and ETH might just be retesting its resistance.
Additionally, its funding rate also remained high, meaning that that long positions are dominant, which suggests bullish sentiment as traders were willing to pay extra to hold their long positions.
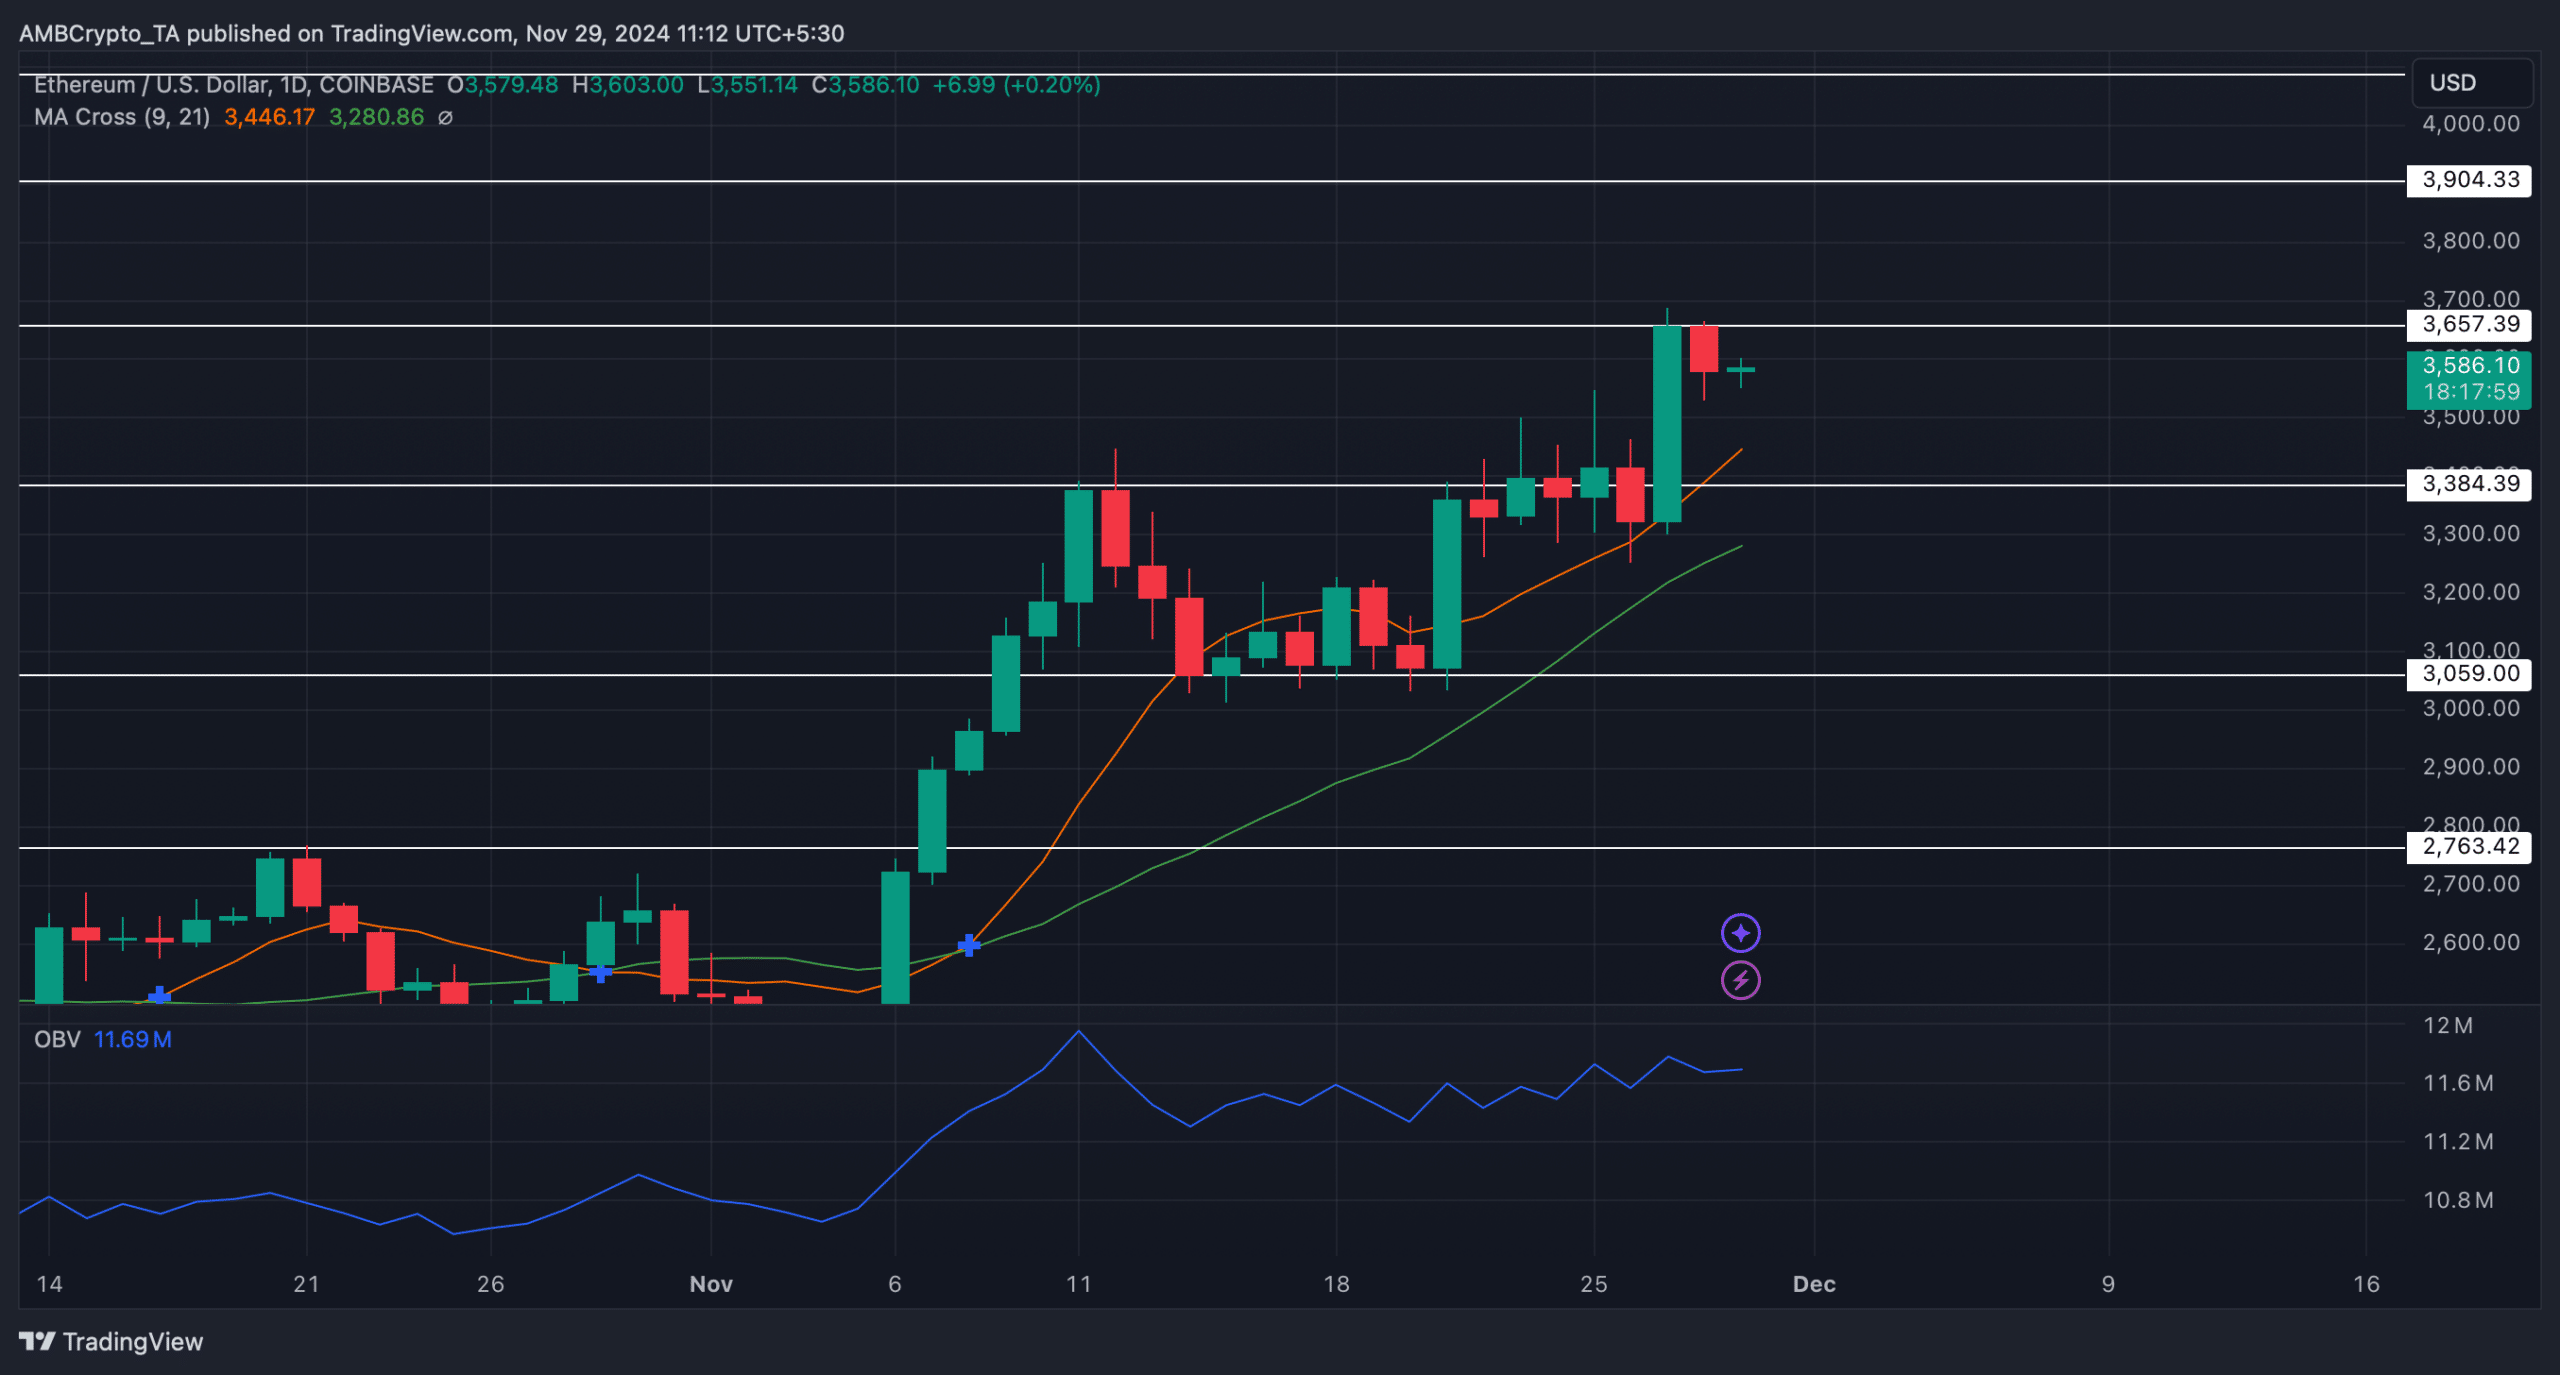
Both these metrics hinted at a price jump above the $3.6k resistance, which could trigger volatility and allow ETH to reach $3.9k in the coming days. As mentioned above, Ethereum’s daily chart also showed that ETH was continuously testing its $3.6k resistance.
Whenever that happens, it indicates that the chances of a breakout are high. This possibility was further support by the technical indicator MA Cross. ETH’s 9-day MA was resting well above its 21-day MA, hinting at a bullish upper hand in the market.
On top of that, while ETH tested its resistance, its On Balance Volume (OBV) remained high.
Read Ethereum [ETH] Price Prediction 2024-2025
An increase in OBV indicates that the trading volume on days with positive price movements is greater than the volume on days with negative price movements—signaling a bullish trend in the market.
Therefore, as suggested by the aforementioned indicators, if ETH crosses $3.6k, its road to $3.9k will be clever. However, in case ETH fails to do so, it might fall to its support near $3.3k.


