TAO’s price breaks 2-month trendline resistance, but is $1000 next?
11/30/2024 17:00
Among the top performers, AI-focused tokens are leading the charge, with Bittensor (TAO) standing out after a 20% surge...

Posted:
- TAO’s price breached its trendline resistance on the daily chart
- A 60% rally could push TAO to the $1000 psychological level
Bittensor (TAO), at the time of writing, was priced at $623.78 following a 9.80% hike in the last 24 hours. This hike coincided with a similar uptick in 24-hour trading volume, with the same climbing to $470.79M – Up by 40.24%.
That’s not all though, with TAO’s daily price now ranging between $551.98 and $638.58 – A sign of strong volatility.
Right now, the altcoin remains over 17% below its all-time high of $767.68. Hence, the question – Can its renewed momentum push the altcoin back to its ATH level?
AI tokens lead rally with Bittensor (TAO)
The market’s altcoins are experiencing a strong rally lately, with their market capitalization increasing by 7.9%. This surge came on the back of Bitcoin’s dominance dropping to 57.0% – Primarily due to its stagnant price action. With Bitcoin struggling to gain momentum, altcoins are capitalizing on the opportunity to attract investor attention, driving up their individual market performances.
Among the top performers, AI-focused tokens are leading the charge, with Bittensor standing out after a 20% surge. Its impressive gains can be largely attributed to TAO’s new compatibility with the Ethereum Virtual Machine (EVM).
This integration marks a significant milestone for Bittensor. Especially as s it enables the network to leverage Ethereum’s infrastructure, enhancing its scalability, speed, and overall functionality.
Parabolic SAR confirms TAO’s breakout
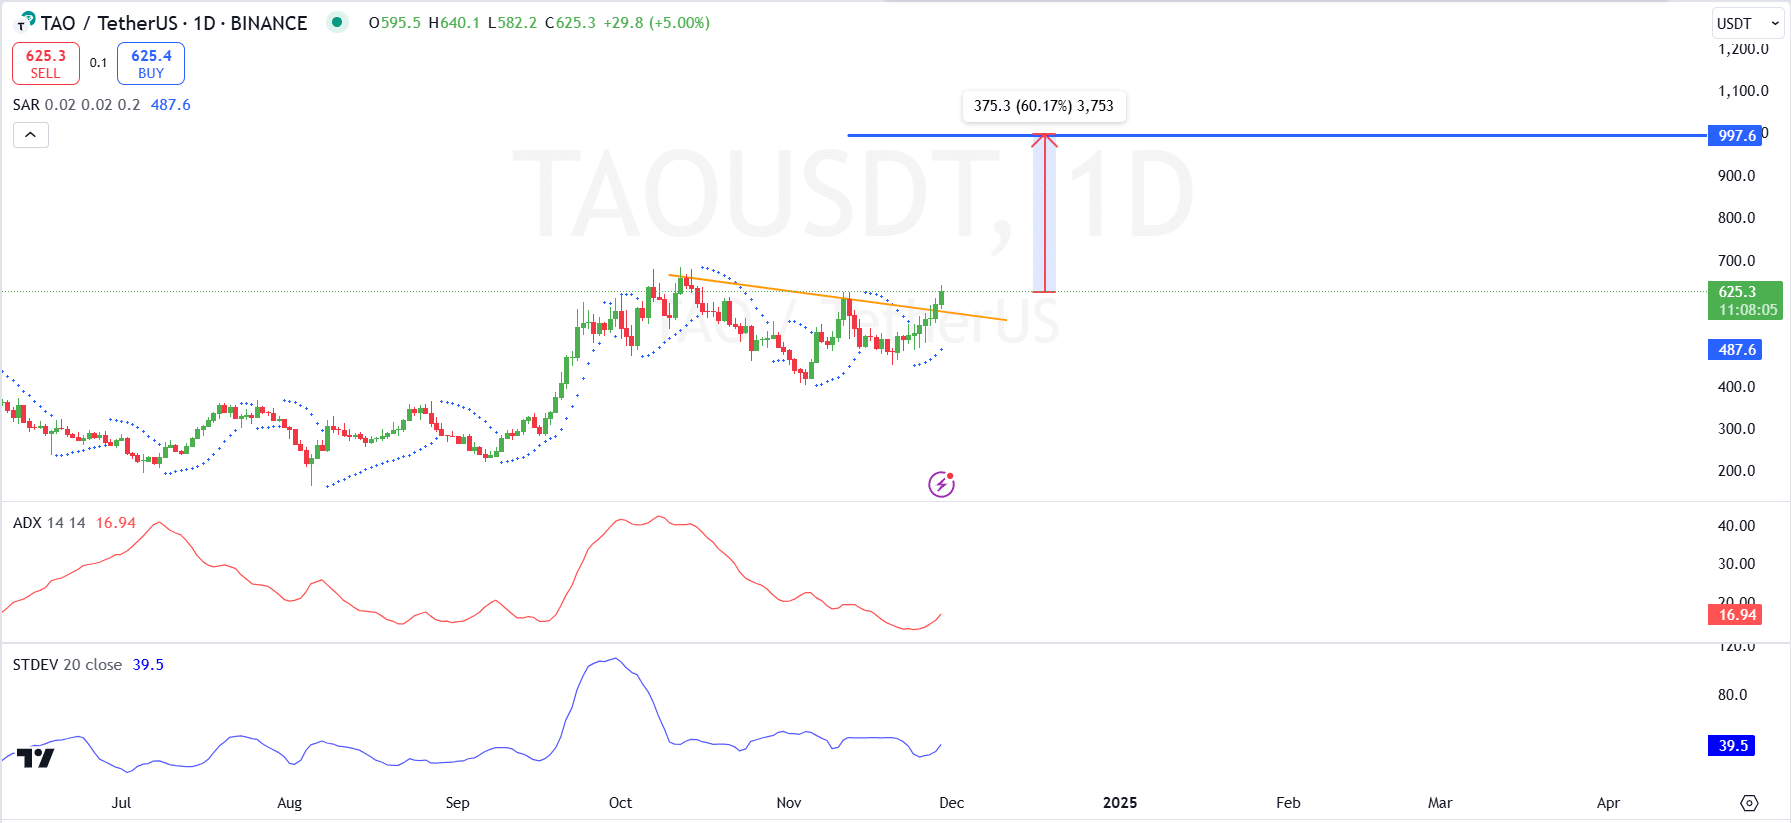
TAO’s daily chart revealed a strong breakout above the descending resistance trendline. The breakout signaled renewed bullish momentum as the price targets the next major resistance level at $1000 – Representing a possible 60.17% upside from its press time price.
The Parabolic SAR indicator confirmed this bullish bias too, with dots positioned below the price candles.
The ADX at 16.94 suggested that while the market trend is still relatively weak, it gained strength following the breakout. Finally, the Standard Deviation at 39.5 pointed to a hike in volatility, in line with the breakout movement.
These metrics, together, proposed an acceleration in bullish activity as momentum built on the charts.
Support levels to monitor include the previous resistance-turned-support at $450. If the bullish momentum sustains itself, the price is likely to head to new highs.
However, failure to hold above $450 could lead to a retest of lower support levels, invalidating the bullish setup.
TAO’s token unlocks
TAO’s token schedule, as visualized by DeFiLlama, illustrated a steady and controlled release of tokens, with significant emission growth starting in 2025 and continuing until 2027.
Its current distribution remains minimal, reflecting the early-stage phase of the project, allowing for gradual ecosystem development without overwhelming the market with supply.
In fact, the token release curve also reveals a sharp hike from 2025, suggesting that a significant portion of tokens will enter circulation within two years.
This uptick aligns with milestones and developments in the Bittensor ecosystem, with the same aimed at driving adoption, rewarding contributors, or scaling operations.
Here, it’s worth noting that this emission strategy minimizes immediate inflation while allowing for a phased expansion of supply – Supporting long-term sustainability.
TAO buyers dominate as long positions exceed 1.10 ratio
Moving to the long/short ratio, it seemed to reveal a consistent hike in bullish sentiment, rising above 1.10 in recent sessions. This indicated that the taker buy volume has been surpassing the sell volume – A sign of strong buying pressure and a positive market outlook for TAO.
Green bars seemed to highlight growing buy-side dominance, especially since 27 November 27 – In line with upward pressure on TAO’s price.
Previous dips below 1.0 earlier in the week reflected temporary consolidation. On the contrary, however, its recent long-dominated activity suggested that traders may be positioning for further upside now.


