DOT’s 16% weekly hike means altcoin can hold this level IF…
12/01/2024 06:00
Polkadot breaks $8.60 resistance, sparking bullish momentum. Traders watch for a rally to $12.61 or risk of a drop back to $4.15.

- Polkadot aims for a 101% rally to $12.61 but risks revisiting $4.15 if $8.60 support fails.
- Positive funding rates and bullish patterns signal optimism as DOT retests its critical $8.60 level.
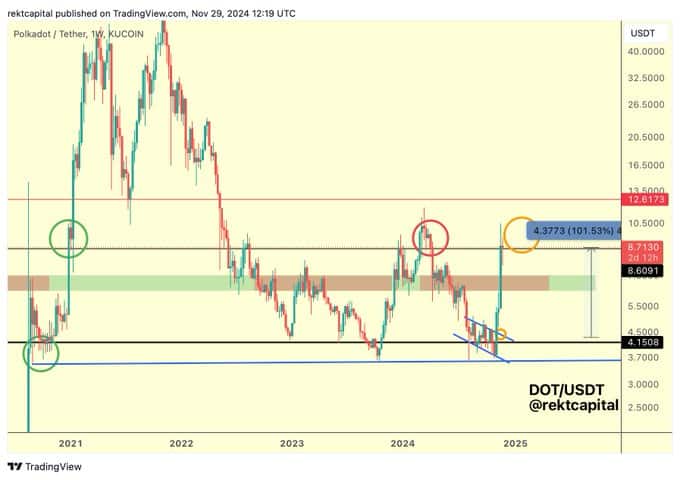
Polkadot [DOT] has successfully closed above the critical $8.60 resistance on the weekly chart. This level has historically played a pivotal role in determining DOT’s price trajectory.
According to analysis from Rekt Capital, DOT is now retesting $8.60 as support, a move that could determine its next direction.
In 2021, a similar retest of this level resulted in a rally to new all-time highs above $50. However, earlier in 2023, DOT failed to hold $8.60 as support, leading to a steep decline to its yearly low of $4.15.
Historical precedent and price targets
The $8.60 level has proven to be a critical inflection point for Polkadot in the past. A successful retest at this level in 2021 led to exponential gains, with DOT reaching its all-time high.
Conversely, the failed retest earlier this year caused significant losses, emphasizing the importance of this key zone.
Should the retest succeed, DOT is expected to aim for the next major resistance at $12.61. From its current position, this marks a potential 101.53% gain, based on historical price behavior.
However, if $8.60 fails to hold, traders could see the price revisit lower levels, including the $4.15 support.
Metrics show bullish momentum
Polkadot was trading at $8.86, at press time, reflecting a 4.40% increase in the last 24 hours and a 16.97% rise over the past seven days.
Meanwhile, the 24-hour trading volume is $1.03 billion, with a circulating supply of 1.5 billion DOT, giving the cryptocurrency a market capitalization of $13.48 billion.
Data from Coinglass shows an 8.74% rise in Open Interest(OI) to $499.25 million, alongside a 22.03% increase in trading volume to $915.97 million.
Additionally, the OI-Weighted Funding Rate for DOT has remained positive since mid-November, reflecting strong demand for long positions.
Spikes in funding rates on the 12th and 18th of November indicate heightened bullish sentiment. This aligns with the ongoing breakout above $8.60.
On-chain activity and technical patterns
On-chain metrics show mixed activity for Polkadot. According to DefiLlama, the Total Value Locked (TVL) in Polkadot stands at $55.89 million, with a 24-hour decrease of 27.44%.
The network’s stablecoin market capitalization is $89.13 million. Despite the TVL decline, the positive funding rates and rising open interest suggest traders are positioning for further upside.
Read Polkadot [DOT] Price Prediction 2024-2025
Technically, Polkadot recently broke out of a bullish falling wedge pattern, which often precedes upward momentum. This breakout aligns with the move above $8.60, reinforcing optimism among traders.
Market participants are now watching the monthly close, which could strengthen the breakout if it holds above $8.60.

