HNT’s bullish patterns suggest a surge to $20: Here’s what to watch
12/09/2024 16:00
HNT could rally to $20, driven by a bullish cup and handle pattern, MACD golden cross, and strong market sentiment.

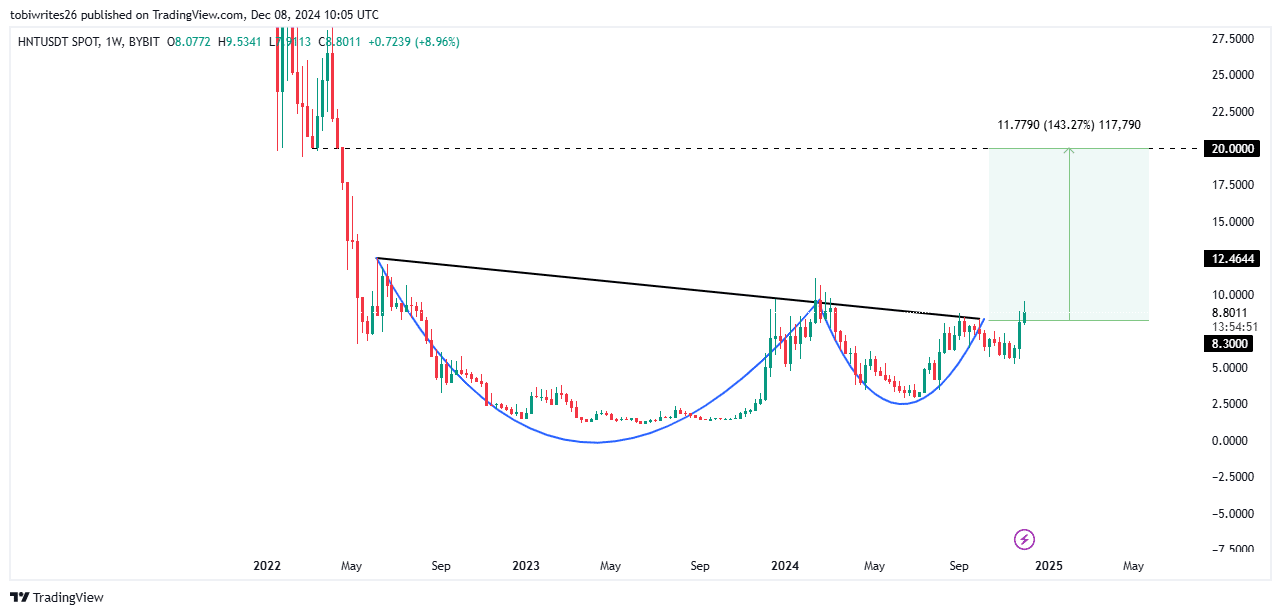
- HNT was trading within a classic cup and handle pattern at press time, a formation often associated with price rallies.
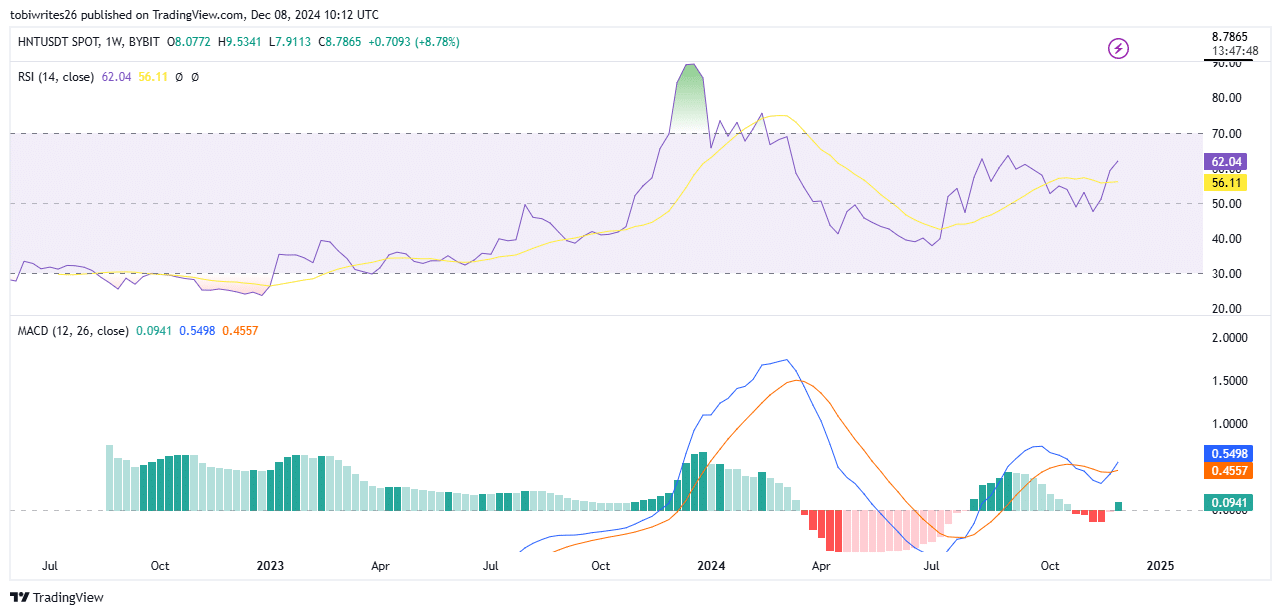
- The MACD has also formed a golden cross, signaling potential upward momentum.
Helium’s [HNT] recent market performance has shown some weakness. The asset has dropped by 4.76% in the past 24 hours, reducing its monthly gain to 42.97% from earlier highs.
Despite this short-term decline, analysis suggests the broader market structure remains intact, leaving room for further upside potential.
HNT’s pending rally
HNT is currently trading within a cup and handle pattern, a structure often associated with significant price rallies.
Although HNT has already begun its upward movement, analysis suggests that a rally could drive the asset to $20, which represents a 143.27% gain and marking the completion of the pattern.
At this level, further upward momentum is possible, but it will depend on the market’s ability to overcome expected sell pressure around $20.
A golden cross: A golden opportunity?
At the time of writing, a golden cross has formed on the price chart, a sign for a significant momentum and a potential rally that supports the ongoing bullish trend.
This pattern occurs when the blue MACD line crosses above the orange signal line. The MACD was at 0.5498 at press time, while the signal line hit 0.4557, as shown on the chart.
Additionally, the Relative Strength Index (RSI)—an indicator used to measure the speed of price changes based on buyer and seller activity—confirms the bullish sentiment.
The RSI was at 62.04, indicating active buying in the market. If the RSI remains below the overbought threshold—70, further gains could follow as the asset continues its upward trajectory.
Buyers on the rise
The derivatives market signals a bullish outlook for HNT, supporting expectations of further price increases.
Is your portfolio green? Check out the Helium Profit Calculator
Data from Coinglass shows that the long-to-short ratio has climbed to 0.9976. This shift reflects a rise in long contracts, indicating a strong likelihood that the asset will continue its upward trend.
The funding rate for HNT also remains positive at 0.0353%, showing that long positions help sustain the price gap between the spot and derivatives markets.

