PEPE Price Pulls Back From All-Time High, Momentum Fades
12/10/2024 21:31
PEPE price weakens as ADX drops to 21.26, signaling fading bullish momentum. RSI stabilizes at 50.5, pointing to neutral market sentiment.
PEPE price is currently down 11.34% from its all-time high that it reached just yesterday, as its uptrend begins to lose steam. Its ADX has decreased from nearly 30 to 21.26, signaling a weakening in the strength of its current uptrend.
While the trend remains above the 20 threshold, indicating that some bullish momentum persists, the drop in ADX suggests that PEPE may not continue to rise with the same intensity in the near future.
PEPE Uptrend Is Losing Its Steam
PEPE ADX is currently at 21.26, down from nearly 30 just a day ago, suggesting a decrease in the strength of the current uptrend. ADX, or the Average Directional Index, measures the strength of a trend. Values above 25 typically indicate a strong trend, while values below 20 suggest a weak or weakening trend.
In this case, the drop in ADX from 30 to 21.26 signals that the upward momentum for PEPE is losing strength, which could lead to a potential slowdown or reversal of the current trend.

Since PEPE is currently in an uptrend, the drop in ADX could indicate that the bullish momentum is fading and the trend might lose steam soon.
As long as the ADX remains above 20, the trend is still considered to have some strength. However, the decreasing ADX suggests that the price may not continue to rise as strongly in the immediate future.
PEPE RSI Is Now In The Neutral Zone
PEPE RSI is currently at 50.5, after briefly reaching above 70 on December 7, indicating a shift in market sentiment.
The drop back to 50.5 suggests that the initial overbought conditions have eased, and the momentum is stabilizing. At this moment, it indicates neither an overbought nor an oversold situation.

The Relative Strength Index (RSI) is a momentum oscillator that measures the speed and change of price movements, ranging from 0 to 100. An RSI above 70 typically signals that an asset is overbought, while an RSI below 30 indicates that it is oversold.
With PEPE’s RSI at 50.5, it suggests a neutral market sentiment, with no strong bullish or bearish momentum. In the coming days, this could mean that PEPE price might consolidate or trade within a range.
PEPE Price Prediction: Can PEPE Test $0.000028 Soon?
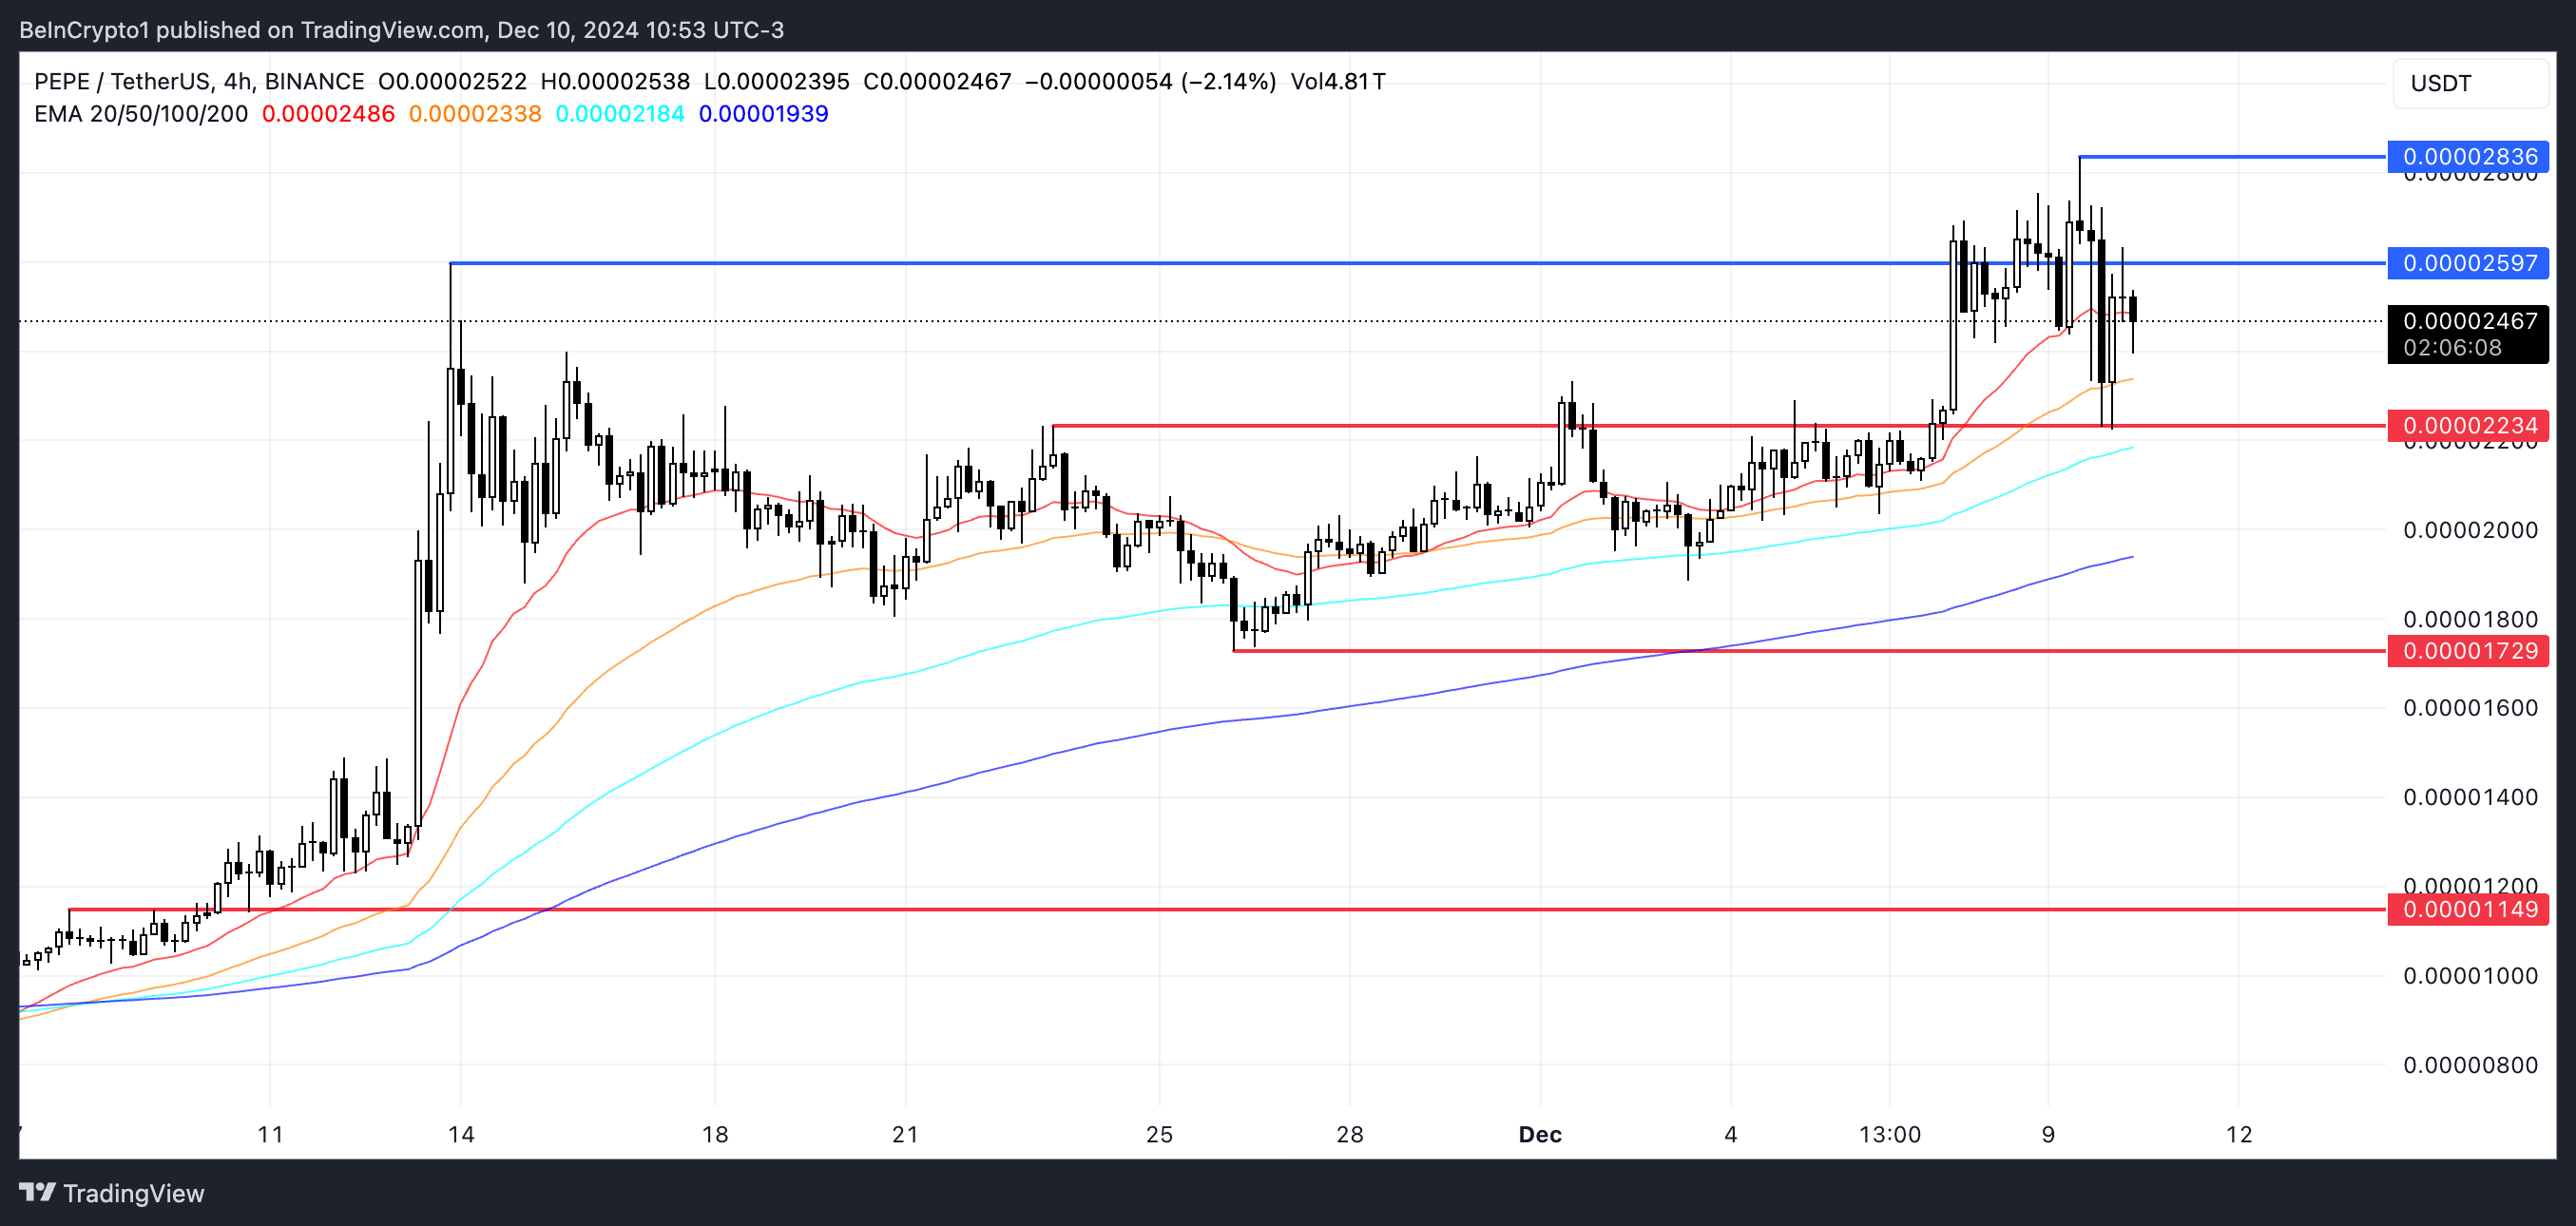
Although PEPE price is still in an uptrend, the strength of the trend appears to be waning, as the price has now fallen below the shortest EMA line, signaling a potential shift in momentum. If the trend reverses and turns into a downtrend, PEPE could soon test the support at $0.000022.
If that level is broken, the price might continue downward, testing further support levels at $0.000017 and possibly as low as $0.000011. That would represent a potential 54% price correction.

The fading uptrend combined with PEPE price position below the short-term EMA suggests increasing downward pressure in the near term.
However, if the uptrend manages to regain strength, PEPE could look to test the next resistance level at $0.0000259. If this resistance is broken, the price might continue its upward movement and test higher levels at $0.000028.
Disclaimer
In line with the Trust Project guidelines, this price analysis article is for informational purposes only and should not be considered financial or investment advice. BeInCrypto is committed to accurate, unbiased reporting, but market conditions are subject to change without notice. Always conduct your own research and consult with a professional before making any financial decisions. Please note that our Terms and Conditions, Privacy Policy, and Disclaimers have been updated.