JUP price prediction – How soon before altcoin recovers all its losses?
12/11/2024 12:00
JUP showed signs of recovery as key support levels and growing accumulation pointed to a potential price rebound...

Posted:
- Altcoin reached the lower boundary of an ascending channel – A key level supported by the Bollinger Bands’ lower range
- Other indicators, such as the Accumulation/Distribution, pointed to a possible upward move alongside rising buying activity
In the last 24 hours, Jupiter’s [JUP] value has dropped significantly, reducing its monthly gains to just 13.24%. Traders who entered the market during this period saw losses of 12.08%, underlining the scale of the market’s downturn.
However, growing accumulation by market participants and improving sentiment could drive JUP’s recovery. This can set the stage for a reversal of recent losses.
Support levels align for a potential JUP rally
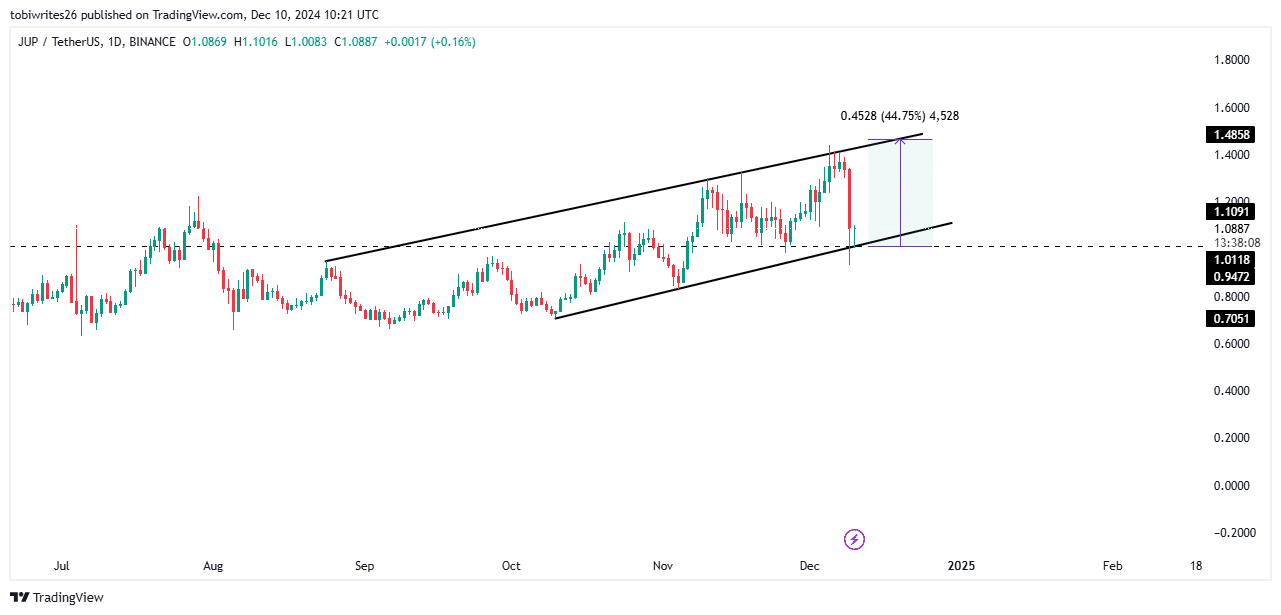
JUP has been trading within an ascending channel, with its recent decline occurring after hitting the channel’s resistance zone.
An ascending channel, as illustrated below, is defined by upward price movement contained within an upper resistance boundary and a lower support boundary.
Its latest drop brought JUP to the channel’s lower support boundary, which coincided with another critical support level at $1.0118. The token has already shown a positive reaction at this level. If this trend continues, JUP could rise to $1.46, marking a potential gain of 44.75%.
AMBCrypto’s analysis found confluence supporting this outlook, including signs of accumulation by market participants which could further fuel the rally.
Potential reversal ahead?
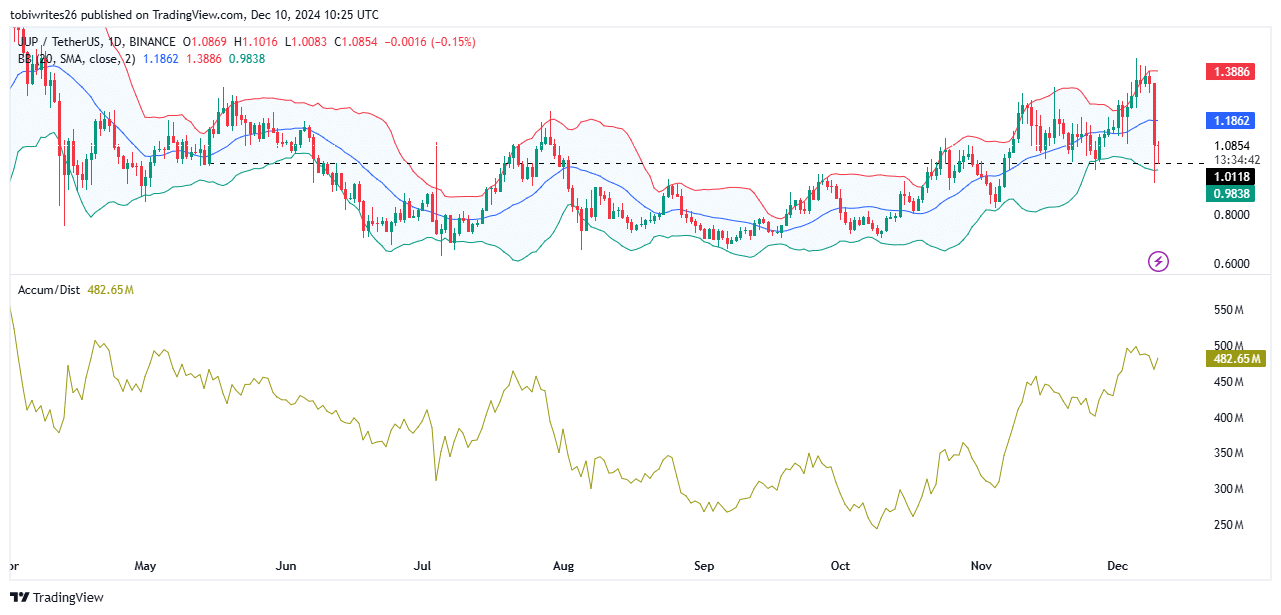
JUP’s recent decline has brought it to the lower bound of the Bollinger Bands, highlighting a potential turning point for the asset.
Bollinger Bands are a widely used volatility indicator, one that features an upper and lower zone around a moving average. The upper zone indicates overbought conditions, while the lower zone signals oversold conditions.
With JUP trading near its lower bound at press time, it suggested that the asset may be oversold, likely weakening selling pressure and paving the way for a potential recovery.
The Accumulation/Distribution indicator further supported this outlook, underlining a rising accumulation trend that confirmed that the market is entering a buying phase.
This upward trend in accumulation also implied that market sentiment has been strengthening, potentially positioning JUP for a recovery from its recent losses.
JUP sell-off risk declines as confidence returns
An analysis of Coinglass’ data alluded to the reduced risk of market participants selling their JUP holdings. This conclusion can be based on the four-hour Exchange Netflows, which turned negative.
Negative Exchange Netflows suggest that more JUP is being withdrawn from exchanges than deposited, reflecting renewed market confidence following its latest 24-hour drop. Such a trend traditionally reduces the availability of JUP on exchanges – A sign of decreased selling pressure.
If this pattern continues, JUP could gain strength as limited supply on exchanges drives higher demand. With accumulation increasing, this scarcity effect may support a hike in the asset’s price.


