Why Solana’s $264.63 All-Time High Could Be Back in Sight
12/12/2024 22:30
The Solana coin price surge signals a potential rally toward its all-time high of $264.63, driven by bullish chart patterns.
Solana (SOL) has experienced a resurgence in price, climbing 5% over the past 24 hours. As of this writing, the altcoin trades at $233.
A look at the coin’s daily chart reveals strong indicators of bullish momentum, suggesting that a rally to reclaim its all-time high of $264.63 — last seen on November 22 — may be on the horizon. This analysis delves into two factors driving this bullish outlook and explains why Solana might soon retest its historical price peak.
Two Key Reasons Solana May Extend Its Gains
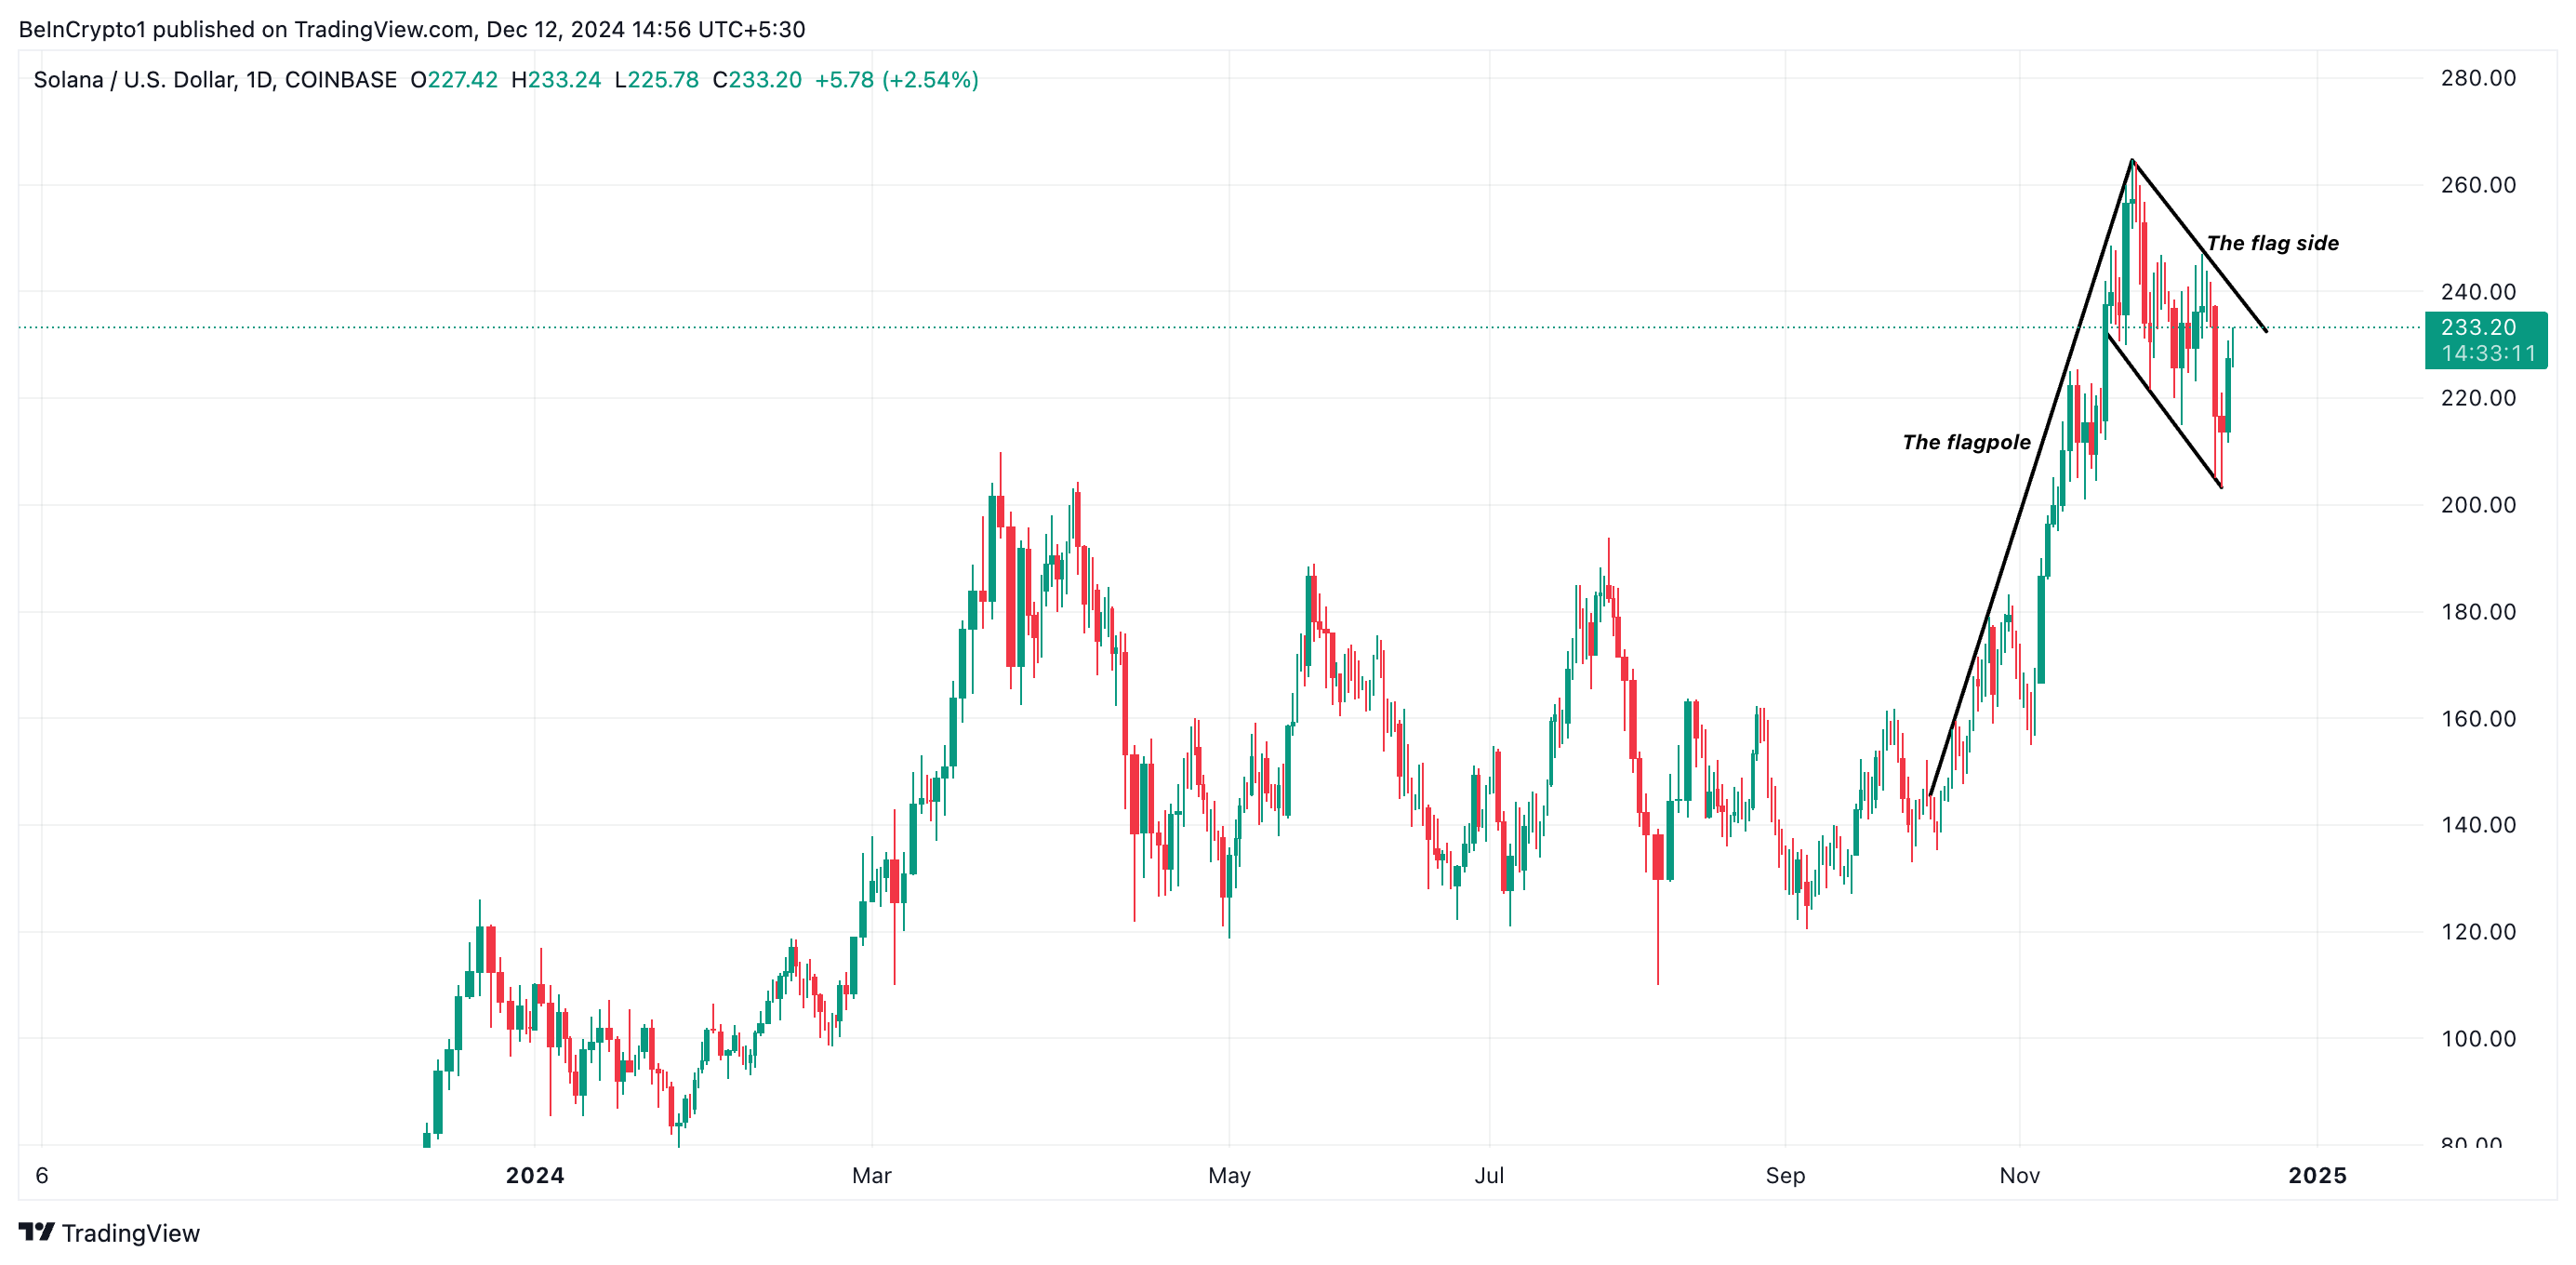
Firstly, a bullish flag pattern has emerged on the SOL/USD daily chart, and the coin’s price trades close to the upper line of the “flag-like” side of this pattern.
A bullish flag pattern is formed after a strong upward price movement, followed by a period of consolidation resembling a downward-sloping or sideways “flag.” This pattern signals that the asset temporarily pauses before likely resuming its upward trend.

As with SOL, when an asset’s price trades near the upper boundary of the “flag-like” side, it suggests strong bullish momentum, as buyers keep the price elevated within the consolidation range. A breakout above the upper line of the flag confirms this pattern and is often followed by a significant rally that mirrors the height of the preceding flagpole.
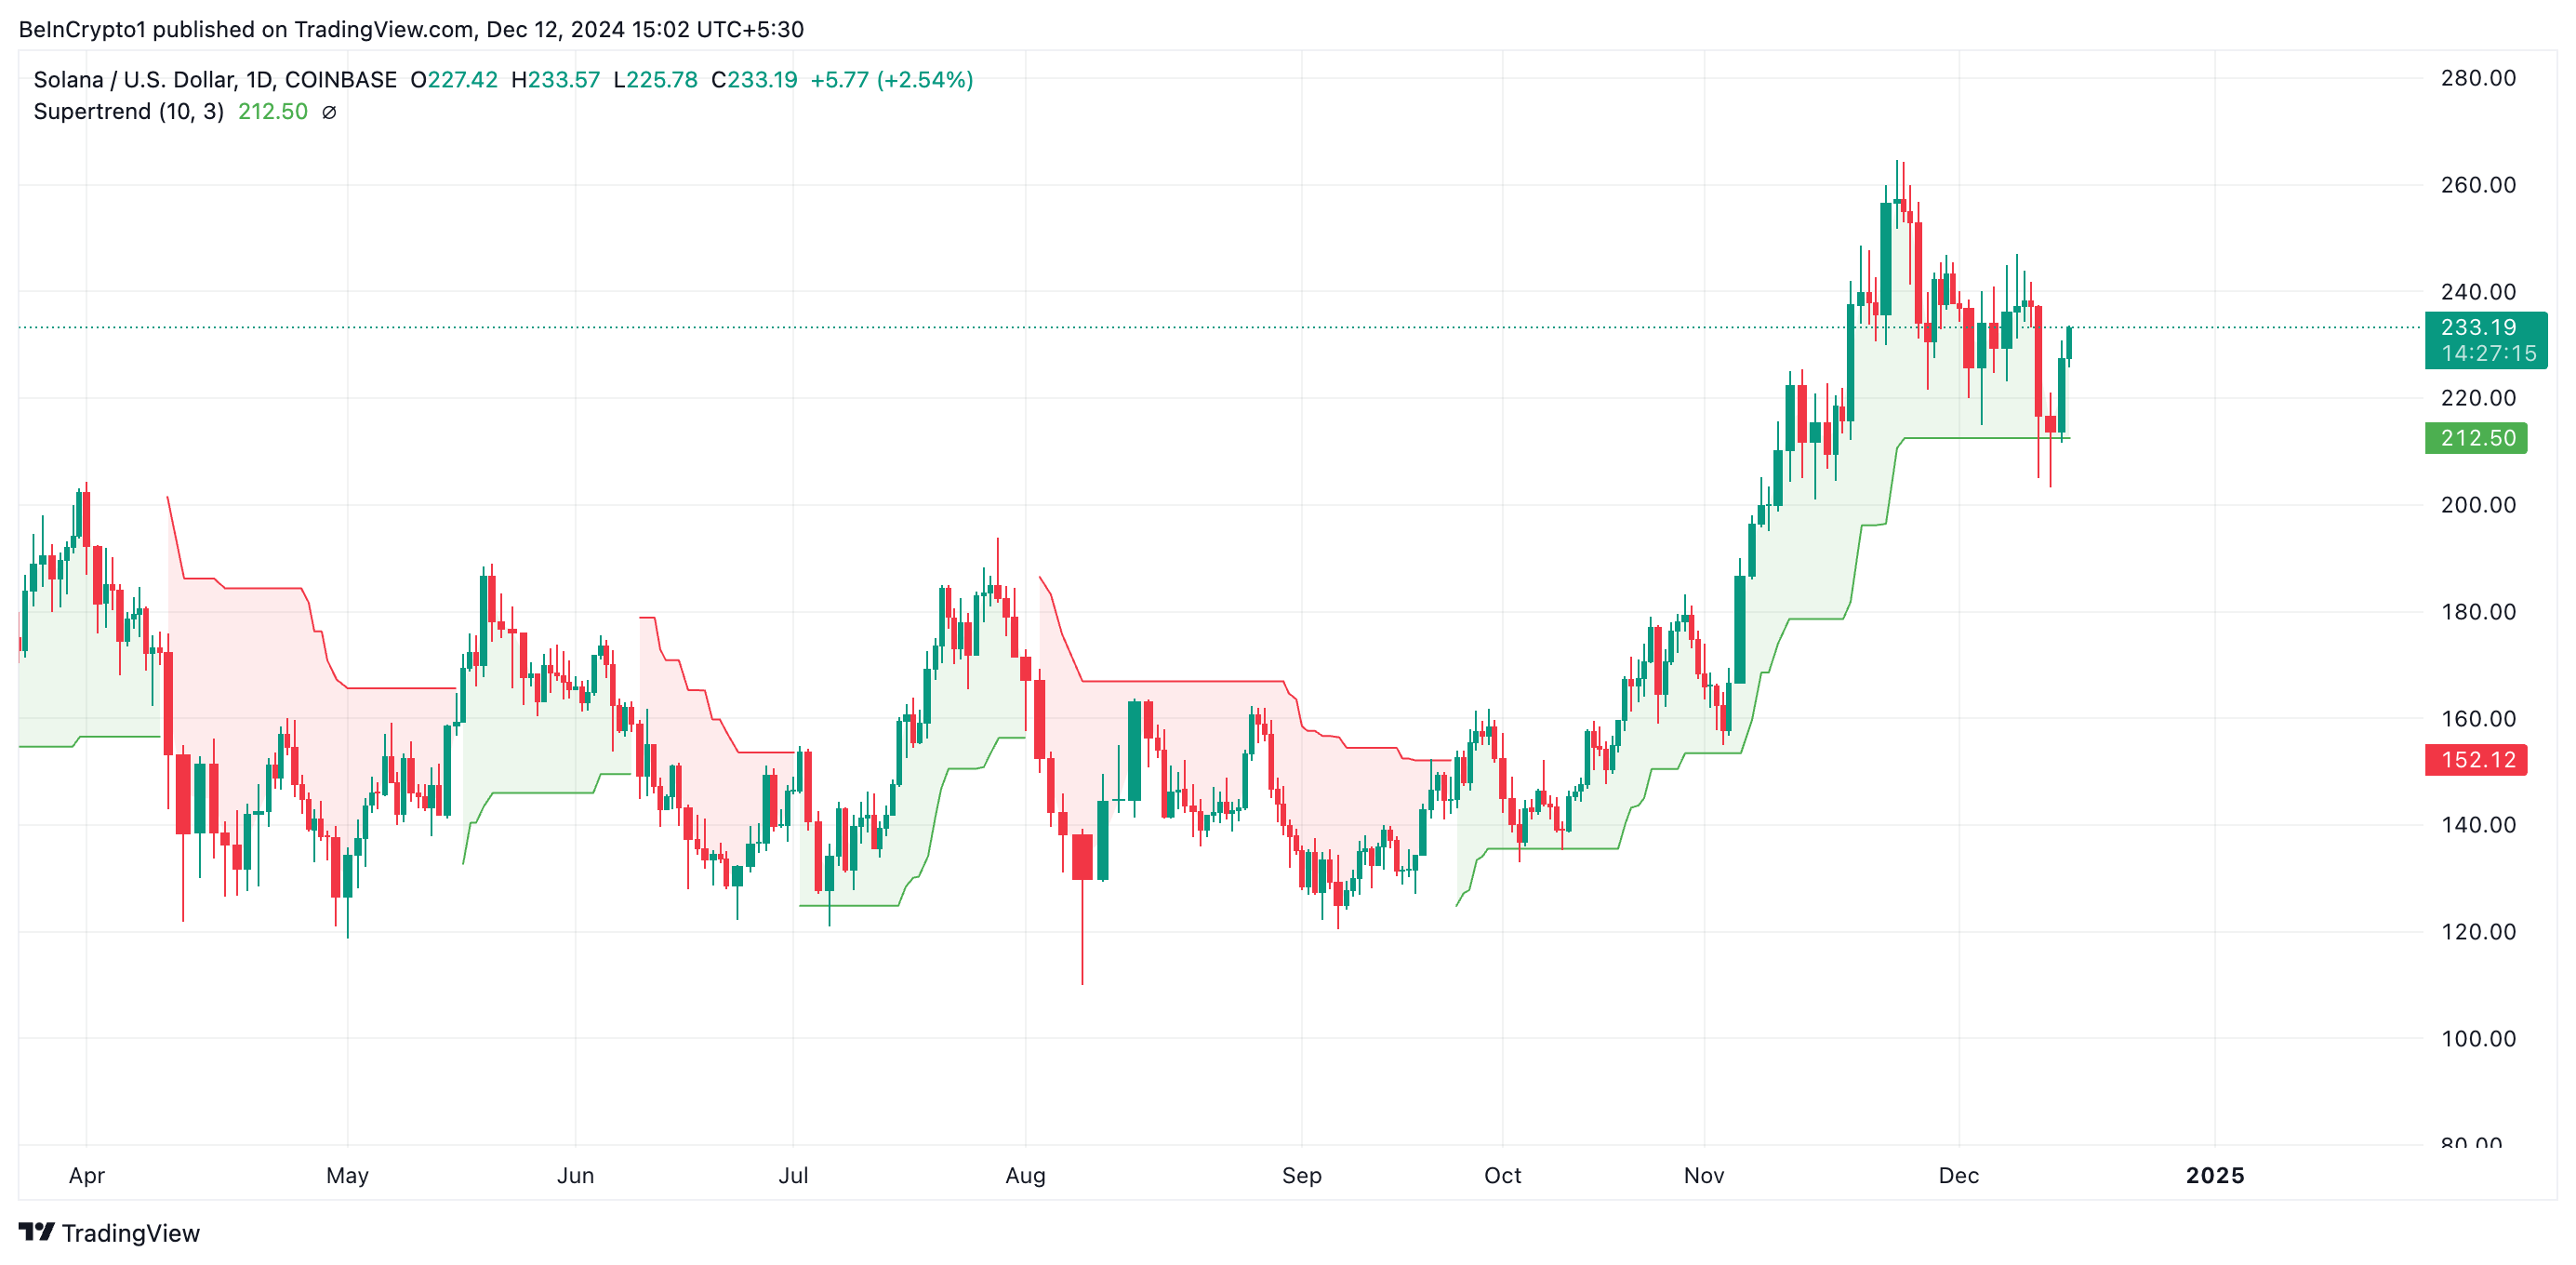
In addition, on December 11, SOL bounced off the dynamic support offered by its Super Trend Indicator at $212.50 and has since climbed by 10%. This indicator measures the overall direction and strength of a price trend. It appears as a line on the chart, changing color based on the prevailing trend: green signifies an uptrend, while red indicates a downtrend.
When the Supertrend line appears below the price, it acts as a support level, signaling a bullish trend and suggesting that the price will likely remain above this level. As in SOL’s case, if the price respects this support, it strengthens the bullish sentiment and hints at a continued rally.

SOL Price Prediction: Why a Break Below the “Flag Side” Is Dangerous
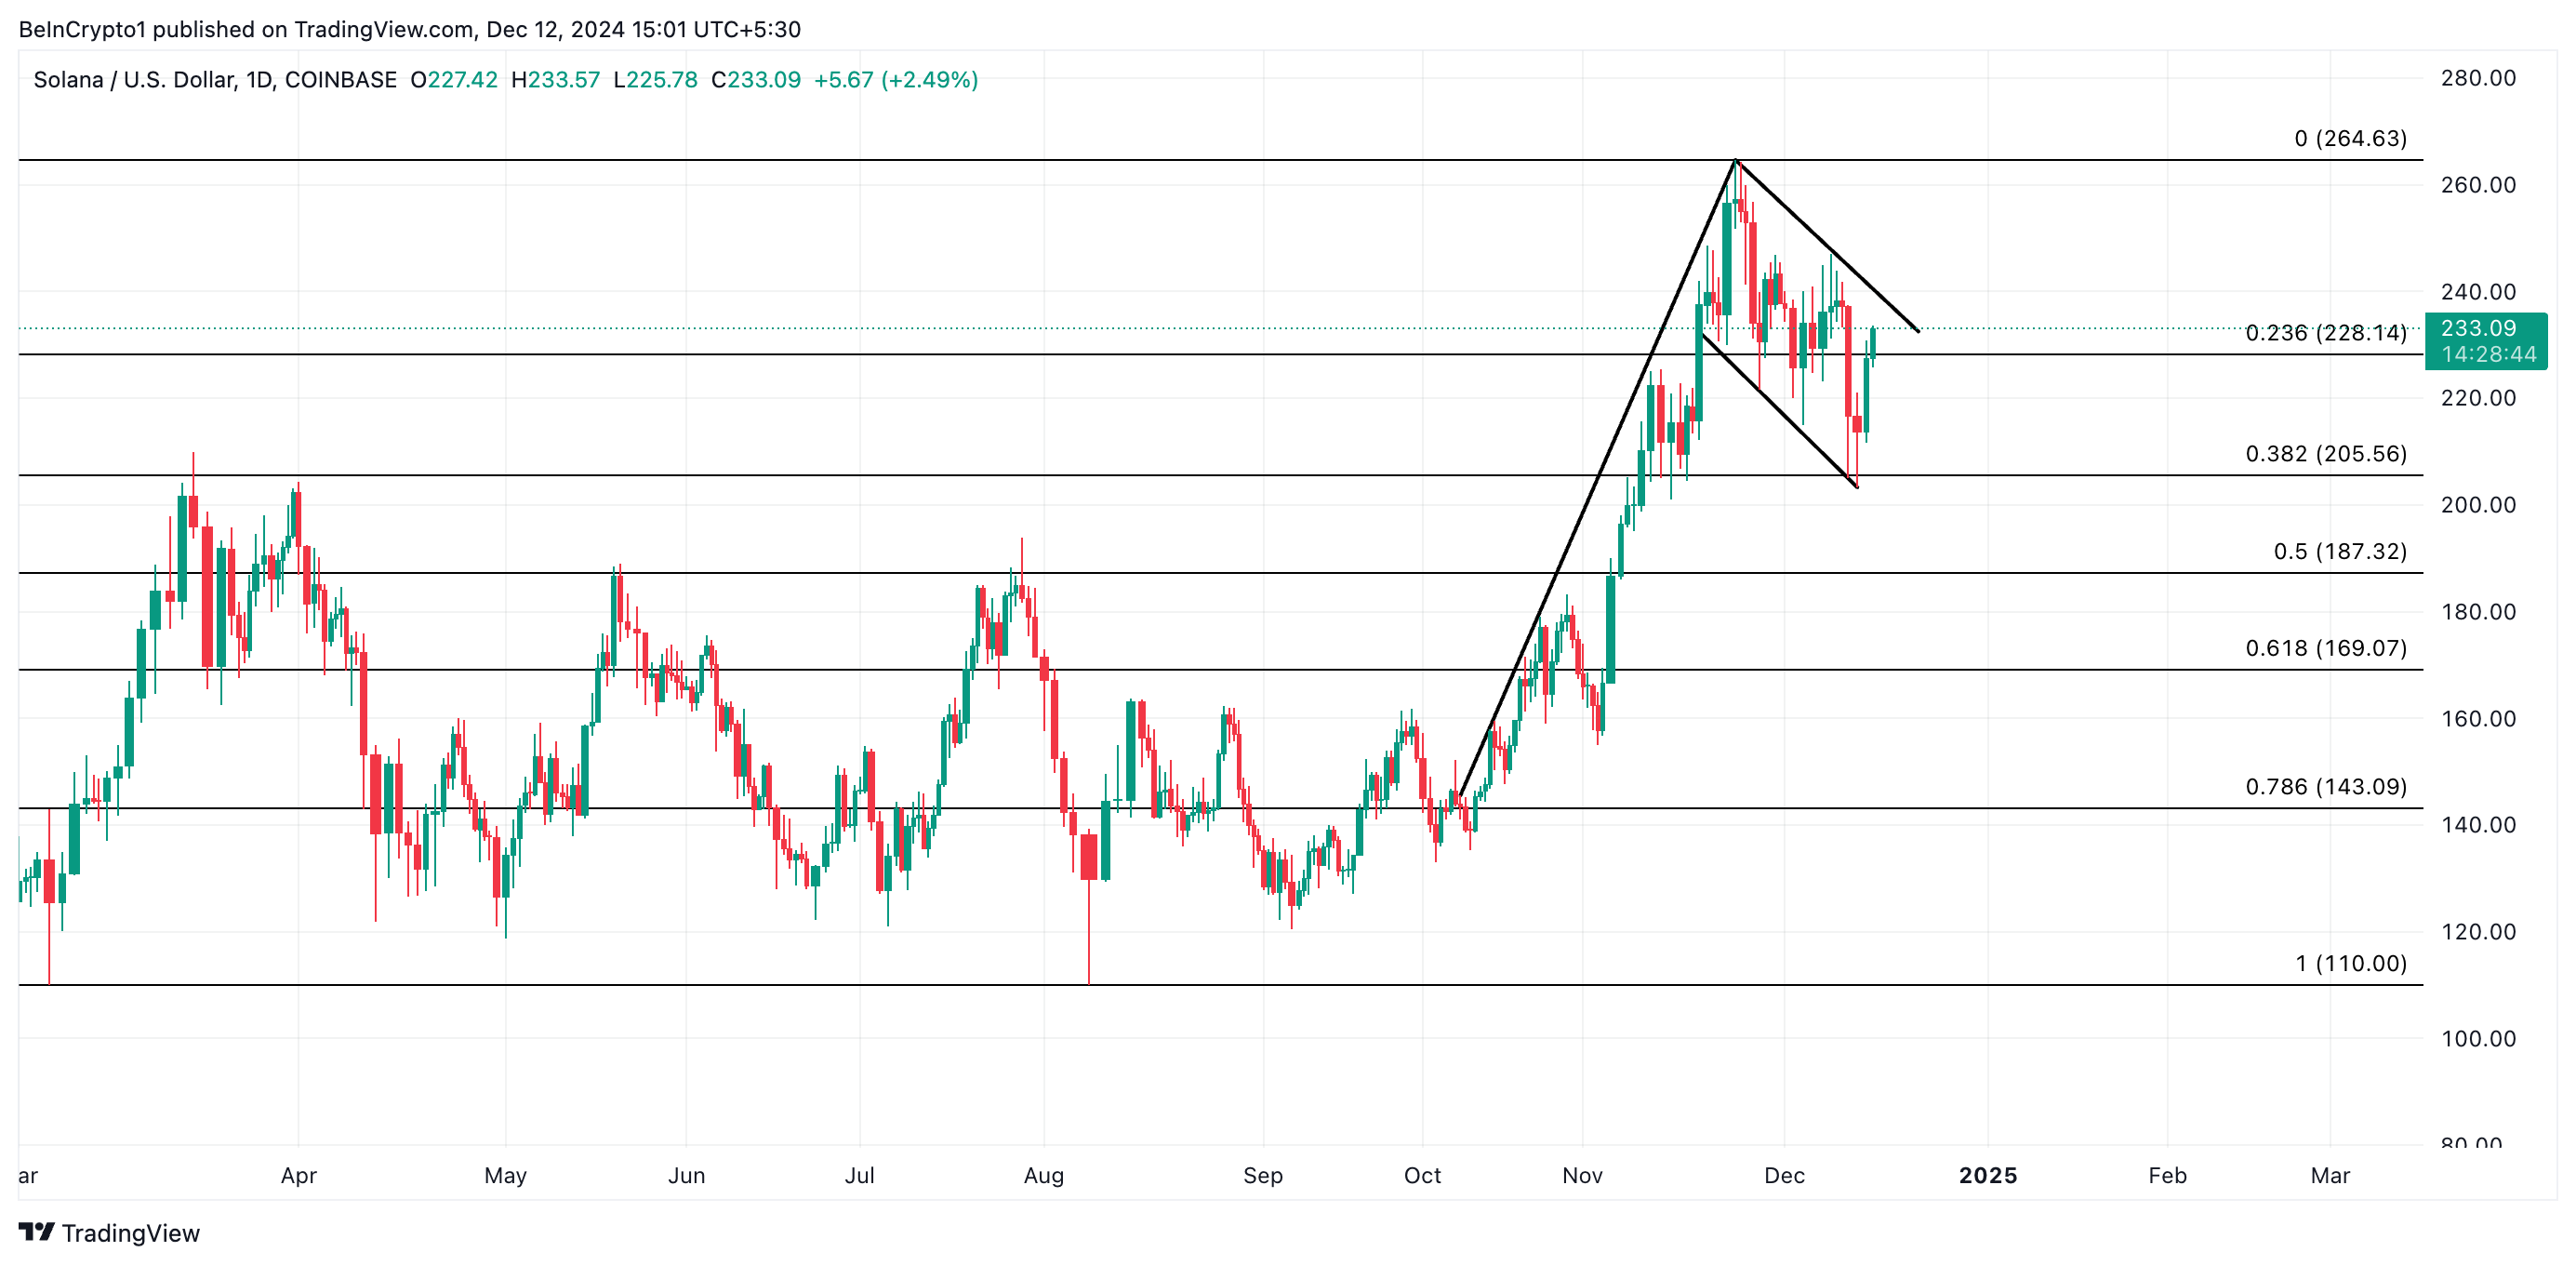
SOL is currently trading at $233.09, just above the support formed at $228.14. A successful breach of the upper line of the consolidation range of the bullish flag pattern will propel the coin’s price toward its all-time high of $264.63.

If the Solana coin price falls below the “flag” side of a bullish flag pattern, it will invalidate the previously predicted positive outlook. Such a breakdown would indicate that selling pressure has overtaken consolidation, potentially shifting momentum toward the downside. In such a case, the Solana coin price may fall to $187.32.
Disclaimer
In line with the Trust Project guidelines, this price analysis article is for informational purposes only and should not be considered financial or investment advice. BeInCrypto is committed to accurate, unbiased reporting, but market conditions are subject to change without notice. Always conduct your own research and consult with a professional before making any financial decisions. Please note that our Terms and Conditions, Privacy Policy, and Disclaimers have been updated.