Key Bitcoin Indicators Suggests $100,000 Is Not BTC’s Final Stop This Cycle
12/15/2024 03:30
Several key Bitcoin indicators suggest $100,000 isn’t its cycle peak. BTC may surge to $112,500 if bullish patterns continue.
Since Bitcoin’s (BTC) price surpassed the $100,000 mark and hit a new all-time high, there has been speculation that the cryptocurrency might have hit this cycle’s top. However, several key Bitcoin indicators suggest that this bias stems from personal opinion and is not supported by historical data.
At press time, BTC trades at $101,449. This on-chain analysis explains why the coin’s price might still have room to grow despite recent consolidation.
Bitcoin Continues to Remain in a Bullish Phase
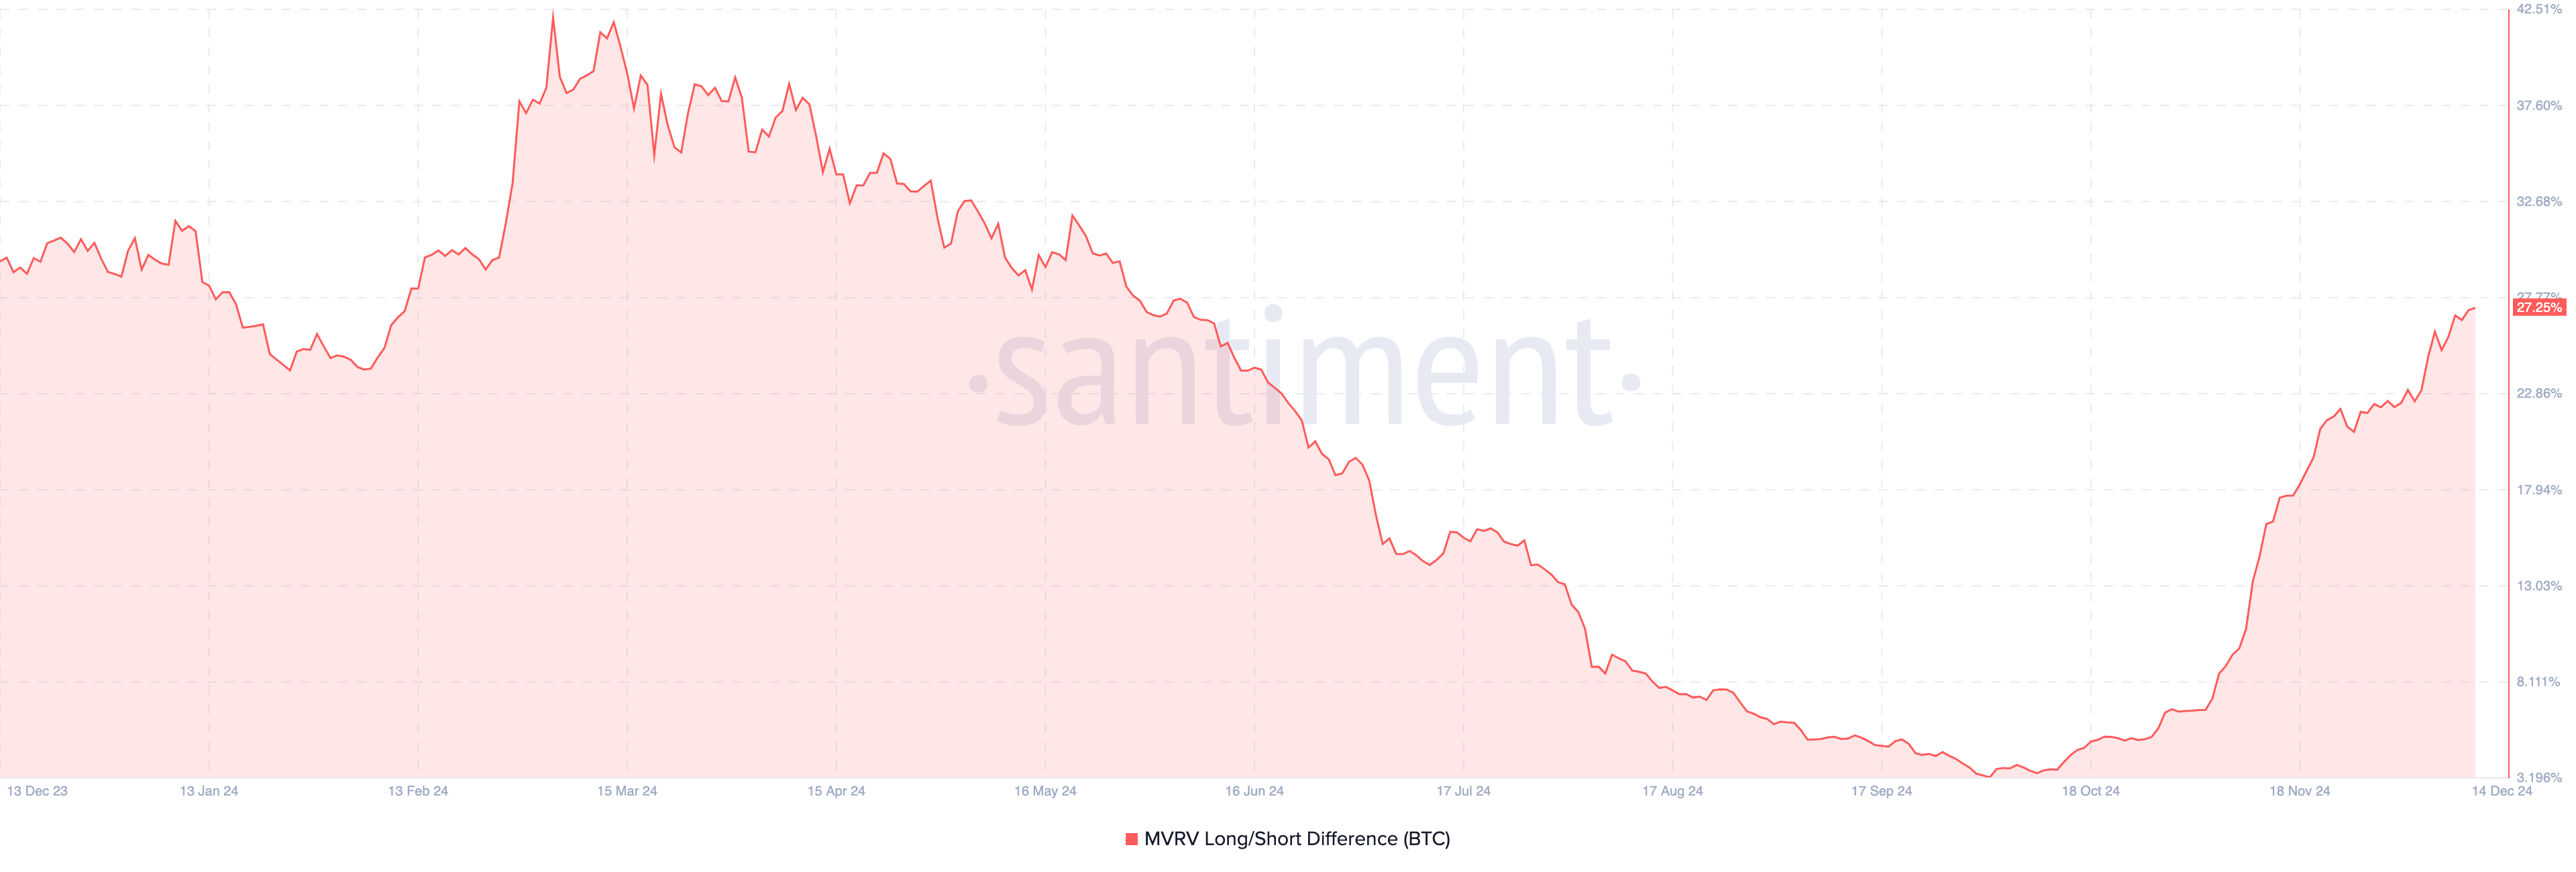
A significant metric suggesting that Bitcoin’s price might rally again is the Market Value to Realized Value (MVRV) long/short difference. Historically, this metric reveals when BTC is in a bull phase or has switched to a bear market.
When the MVRV long/short difference is in positive territory, it indicates that long-term holders have more unrealized profits than short-term holders. Price-wise, this is bullish for Bitcoin. On the other hand, when the metric is negative, it implies that short-term holders have the upper hand, and in most cases, it signifies a bearish phase.
According to Santiment, Bitcoin’s MVRV long/short difference has risen to 27.25%, indicating that the current cycle is a Bitcoin bull market. However, the reading is far below 42.08, which it reached in March before experiencing months of consolidation and correction. Going by historical data, this current condition suggests that BTC is likely to surpass its all-time high before the top of this cycle.

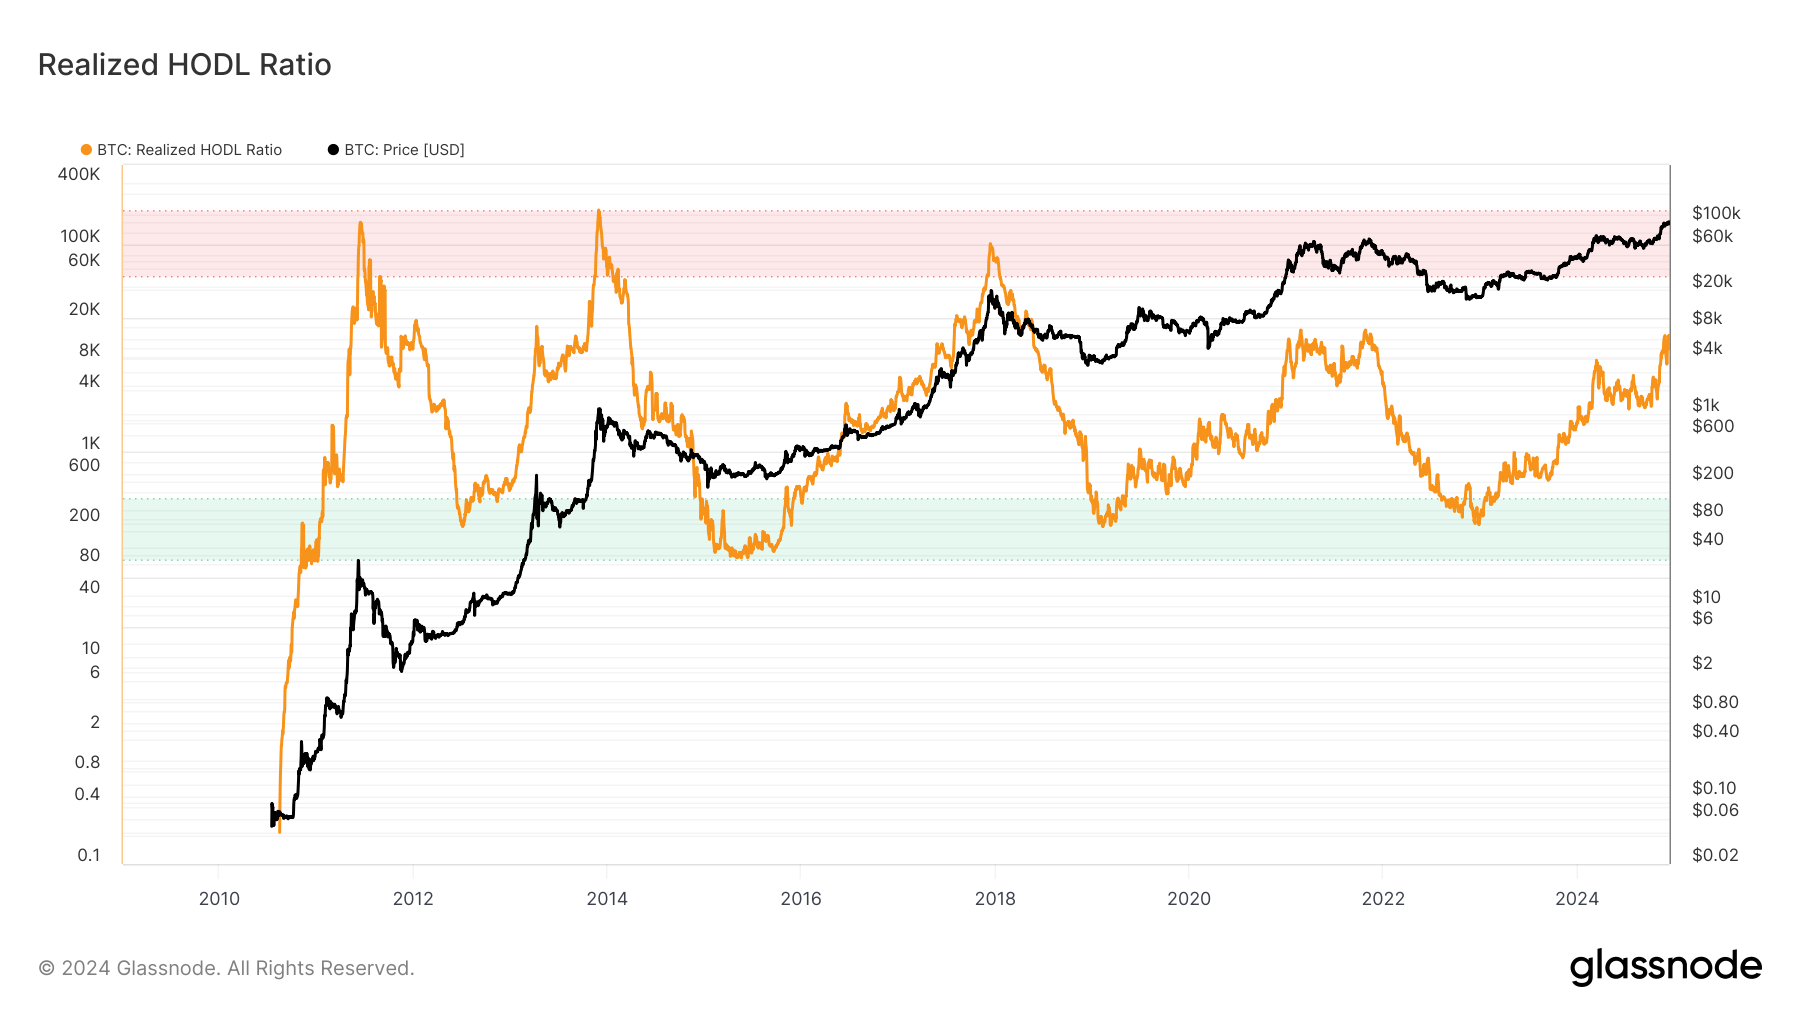
The Realized HOLD ratio, commonly referred to as the RHODL ratio, is another key Bitcoin indicator supporting this bias. The RHODL ratio is a widely regarded market indicator designed to analyze Bitcoin’s market bottoms and tops.
A high RHODL Ratio suggests the market is overheated with significant short-term activity, often used to signal cycle tops or impending corrections. A low RHODL ratio, on the other hand, indicates strong long-term holding sentiment, implying undervaluation.
Based on Glassnode’s data, the Bitcoin RHODL ratio is above the green zone, indicating that it is no longer at the bottom. At the same time, it is below the red area, signifying that BTC price has not hit the top. If this remains the same, then Bitcoin might rally above its all-time high of $103,900.

BTC Price Prediction: Coin to Hit Higher Values
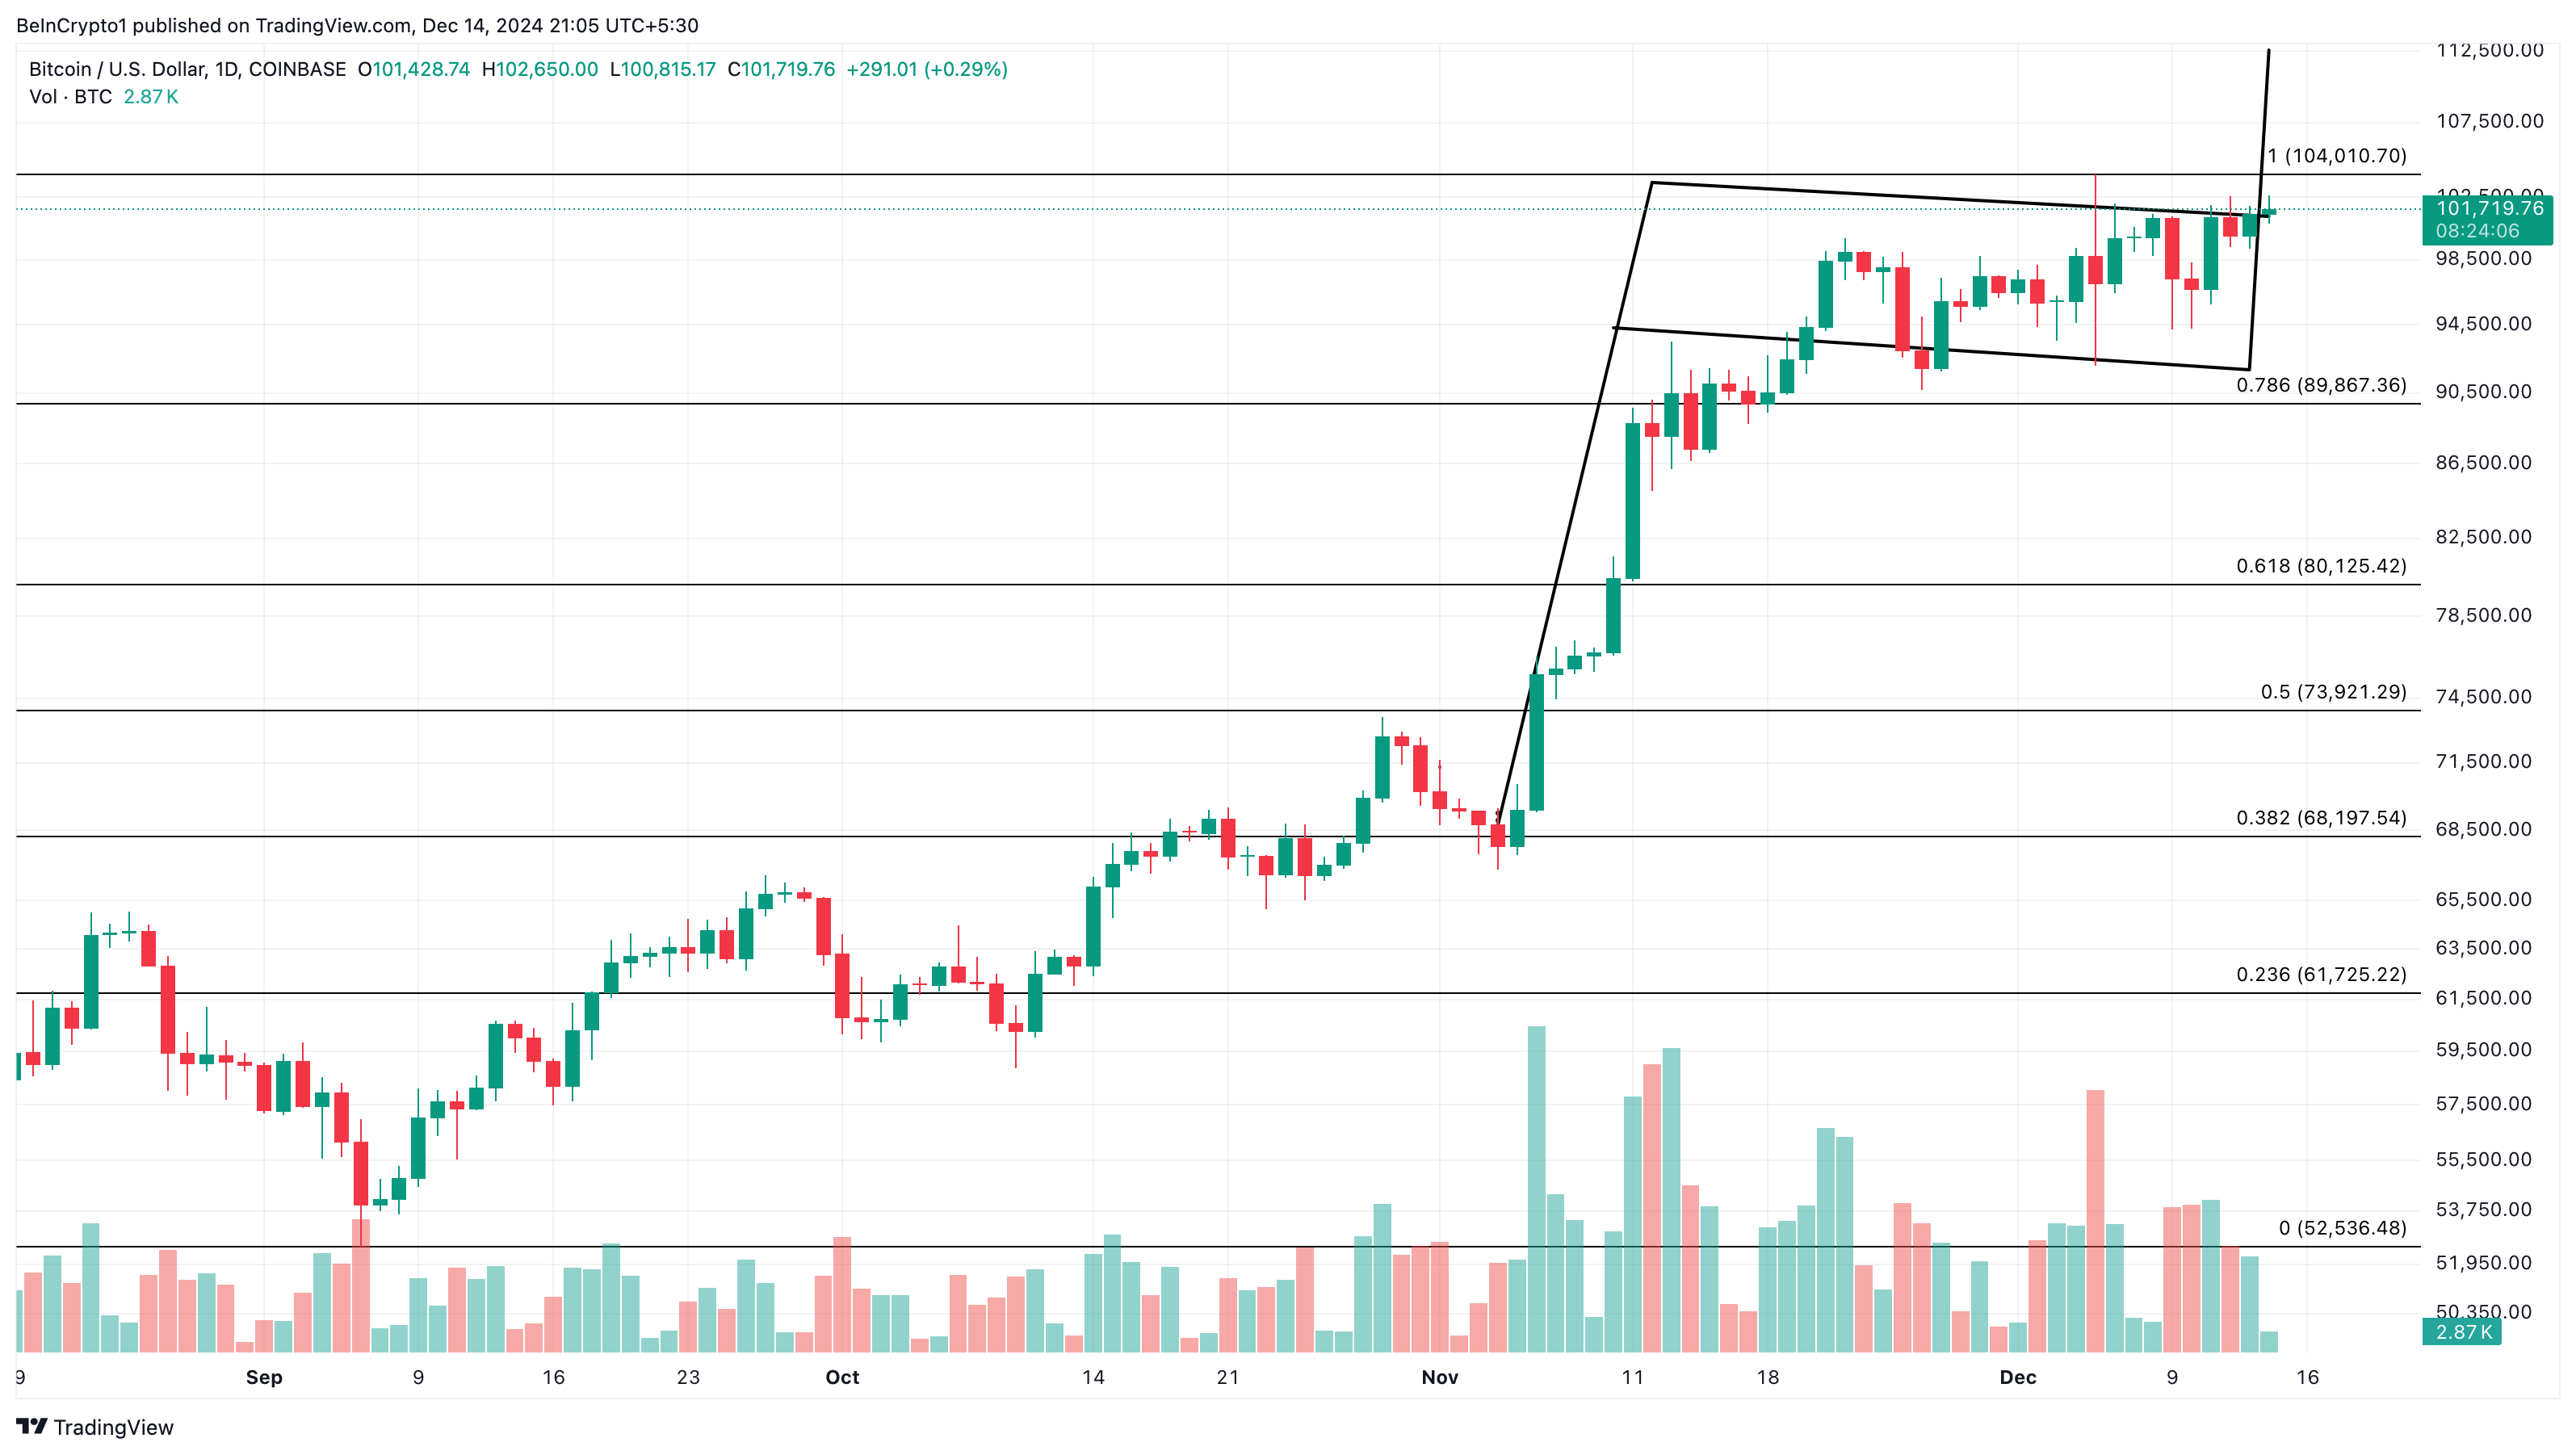
A look at the daily chart shows that Bitcoin has formed a bull flag. A bull flag is a technical pattern that indicates a potential continuation of an uptrend. The pattern shows the flagpole, which represents the initial strong upward price movement
The uptrend at this time indicates aggressive buying and increased trading volume. The pattern, however, is followed by sideways or downward consolidation near the high of the initial move. This is called the flag and takes the shape of either a rectangle or a pennant, formed by slightly lower highs and lower lows.
Bitcoin appears to have broken above the flag’s upper boundary. With this position, the cryptocurrency’s value could rise to $112,500.

However, if the BTC price drops below the flag’s lower boundary, this prediction might be invalidated. It could also happen if the key Bitcoin indicators flip bearish. In that case, the value could slide to $89.867.
Disclaimer
In line with the Trust Project guidelines, this price analysis article is for informational purposes only and should not be considered financial or investment advice. BeInCrypto is committed to accurate, unbiased reporting, but market conditions are subject to change without notice. Always conduct your own research and consult with a professional before making any financial decisions. Please note that our Terms and Conditions, Privacy Policy, and Disclaimers have been updated.