Polkadot’s make or break moment at $7: Road to $30 in sight?
12/22/2024 15:00
Polkadot [DOT] bled a substantial amount of its market capitalization last week as its value dropped in double digits.

Posted:
- Market sentiment around the token looked bearish.
- Derivatives metrics hinted at a possible price rise soon.
Polkadot [DOT] bled a substantial amount of its market capitalization last week as its value dropped in double digits. However, there was more to the story. Investors might soon witness a major comeback from DOT as the token was testing a critical support zone.
Polkadot at a crossroad!
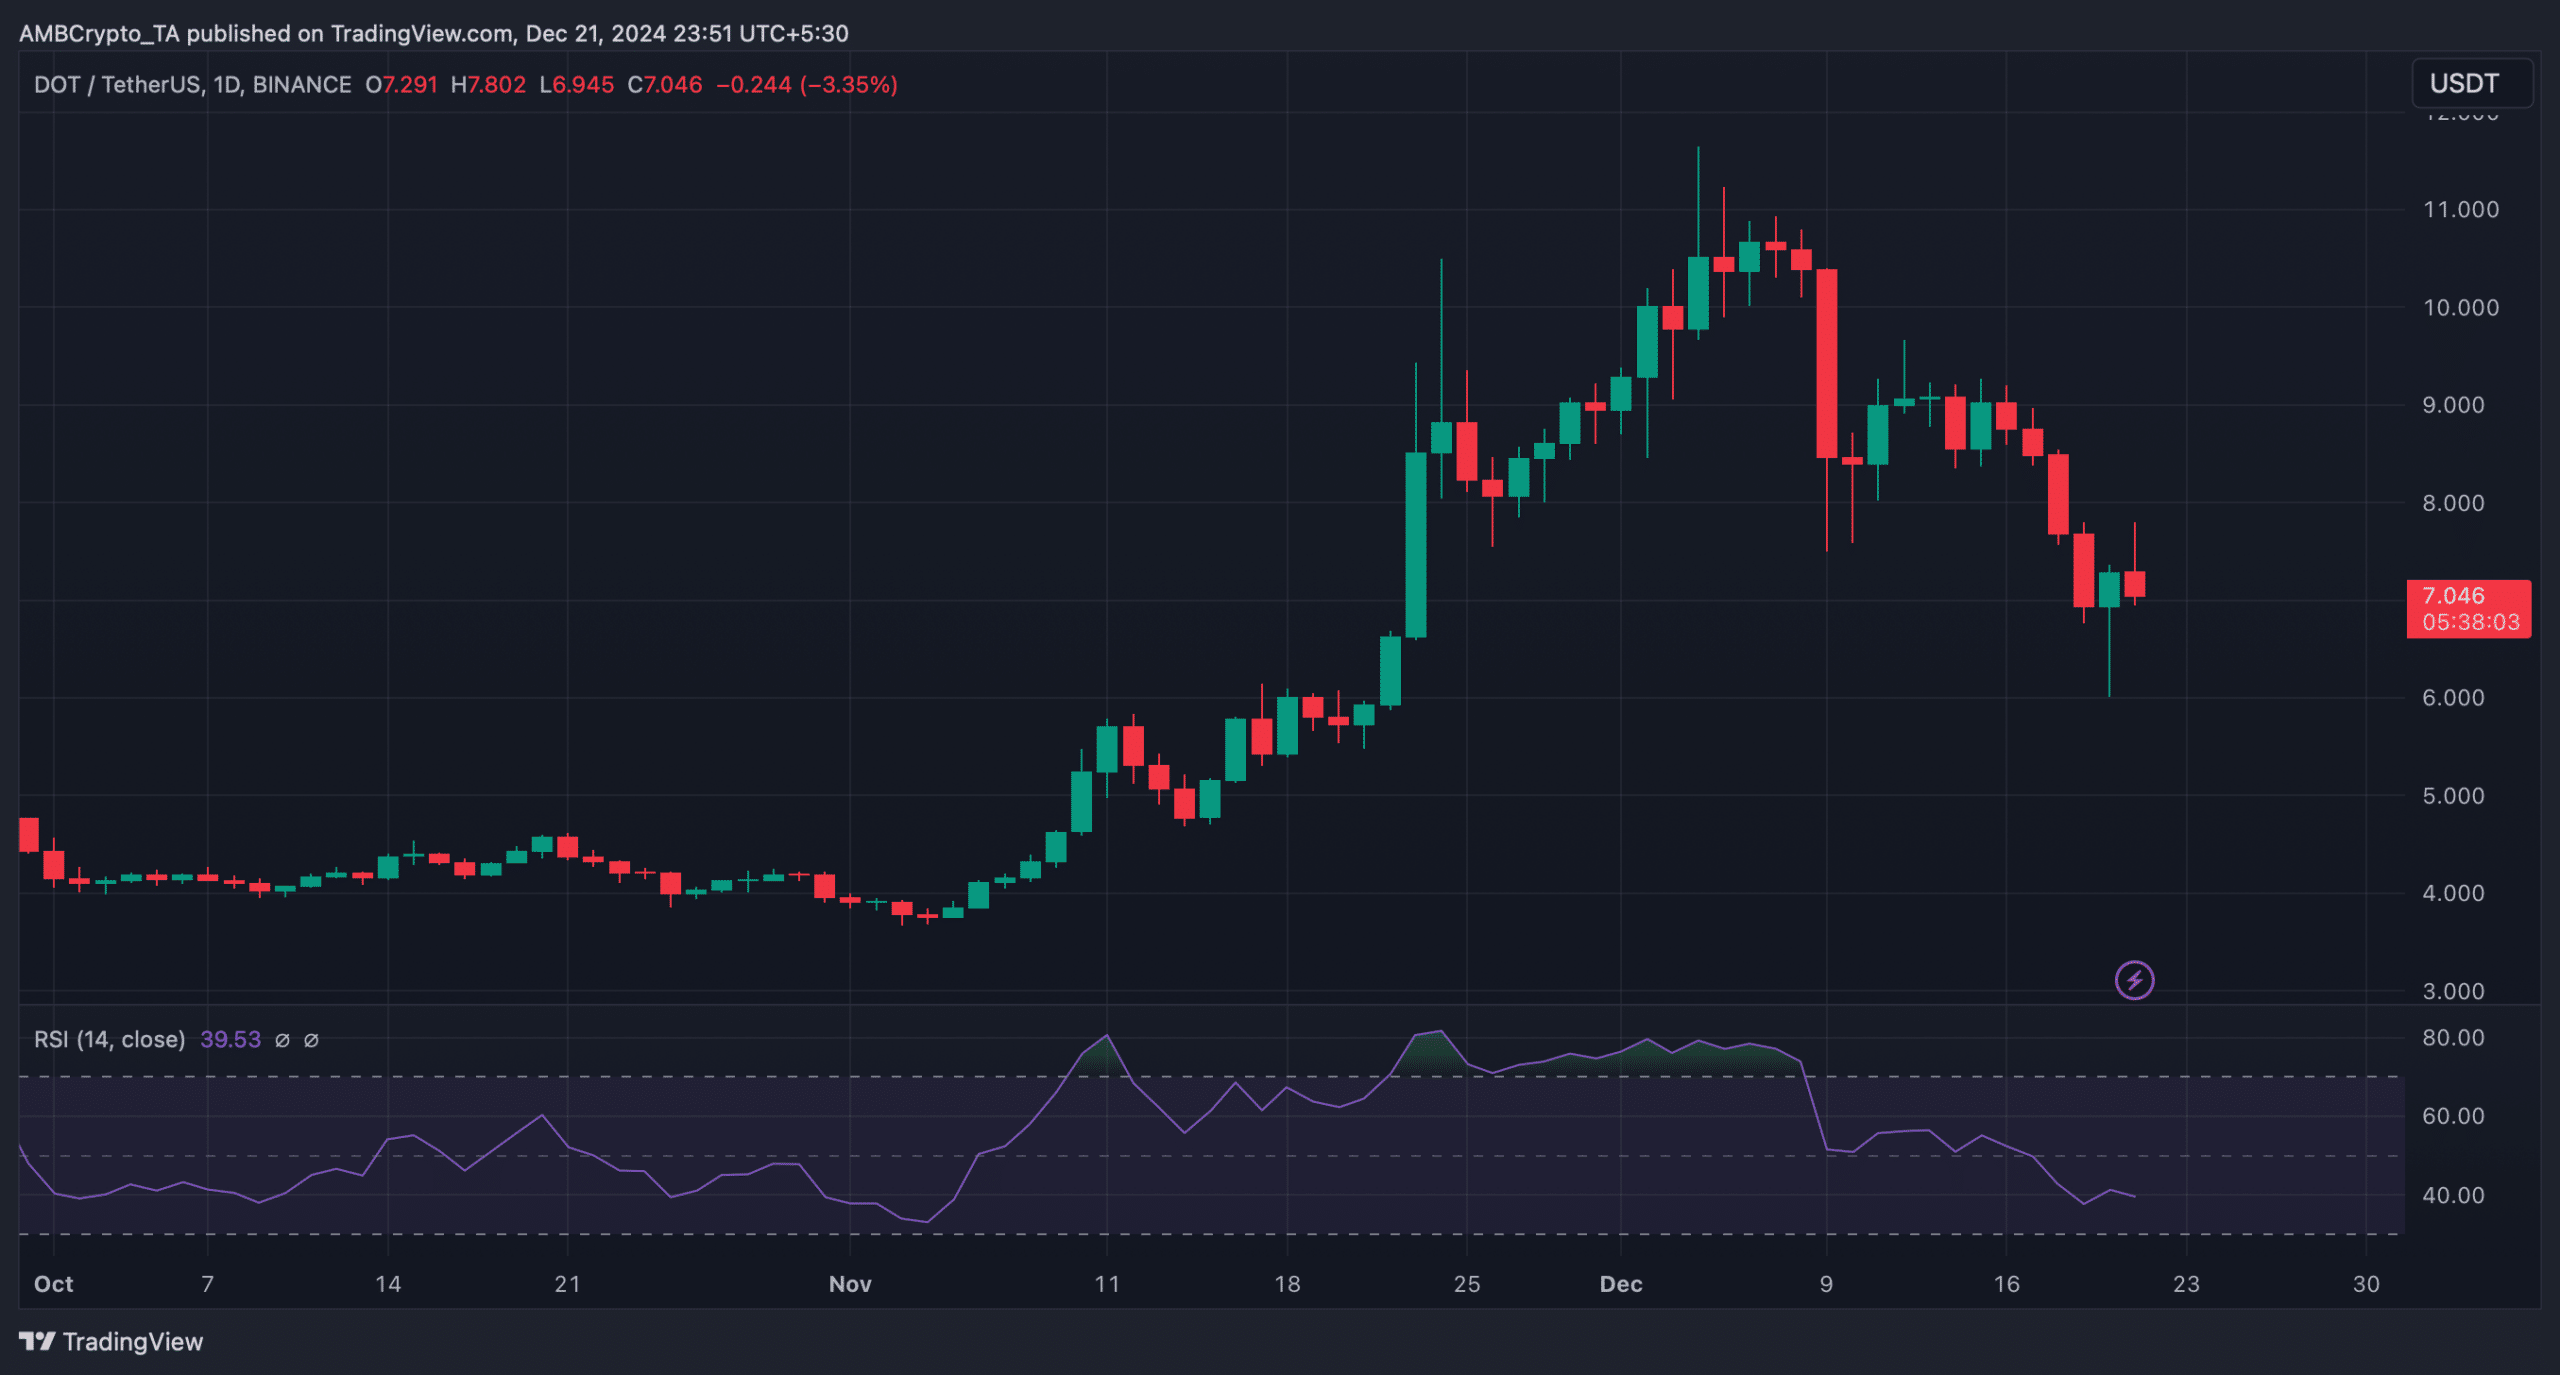
CoinMarketCap’s data revealed that DOT experienced an over 17% price drop last week. At the time of writing, the token was trading at $7.08 with a market cap of over $10 billion.
In the meantime, World Of Charts, a popular crypto analyst, posted a tweet revealing what DOT was up to. As per the tweet, DOT had already bounced from a critical trading zone and was testing a support.
A successful retest of the support could initiate a new bull rally, which can send DOT to new highs. According to the tweet, the analyst expects a bull rally towards $30 in the mid-term.
Is a successful test possible, or will DOT fall further?
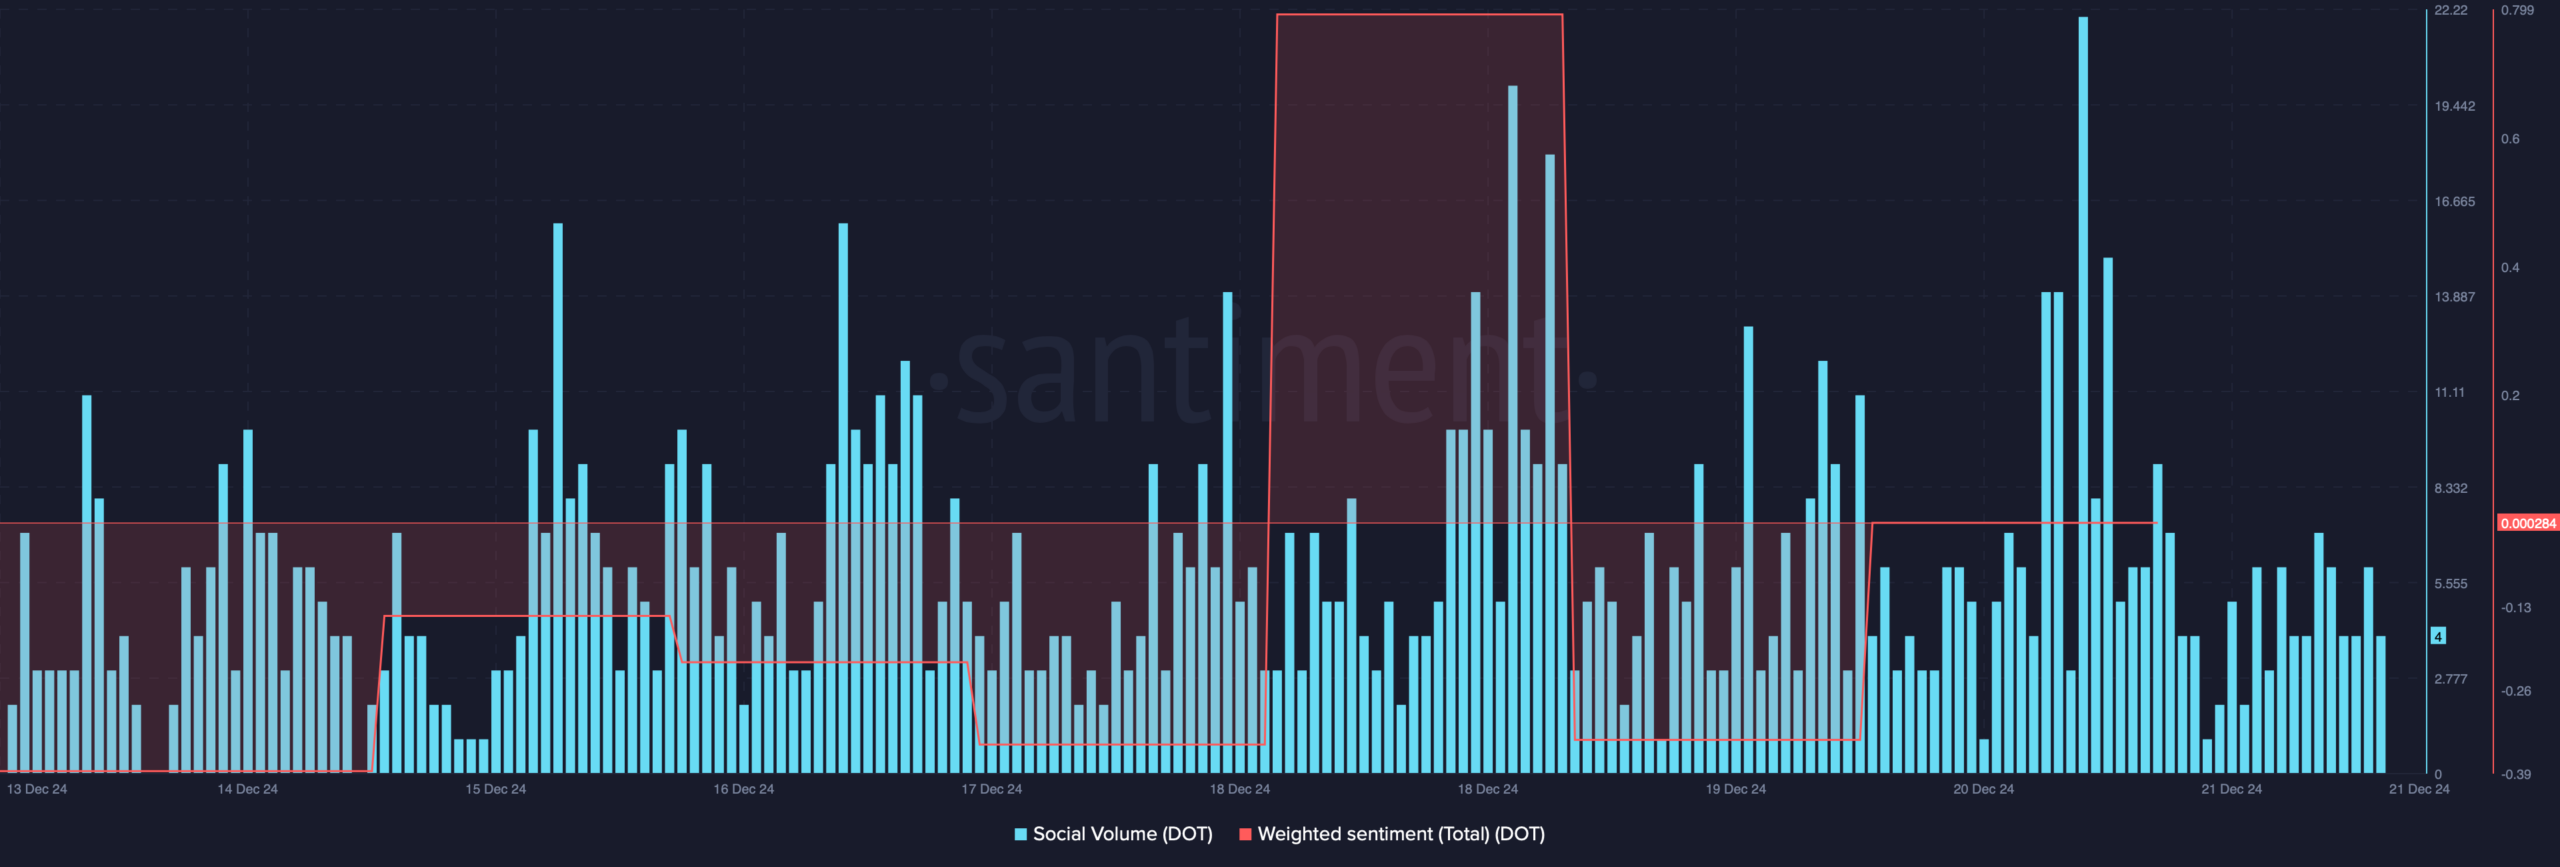
AMBCrypto’s analysis found that while the token’s price fell victim to a major correction, its weighted sentiment dropped after spiking on the 18th of December.
A decline in the metric indicates rising bearish sentiment around a token in the market. In fact, its social volume spiked during the downtrend, suggesting that investors were talking about Polkadot.
Nonetheless, one of Polkadot’s derivatives metrics looked optimistic, hinting at a successful test of the aforementioned support.
As per Coinglass’ data, DOT’s long/short ratio increased in the 4-hour timeframe. This clearly meant that there were more long positions in the market than short positions—a sign of a steady increase of bullish sentiment around Polkadot.
Notably, while the derivatives metric hinted at a successful test, the technical indicator Relative Strength Index (RSI) told a different story. The indicator registered a decline over the last few days and at press time had a value of 39.
Whenever the indicator drops, it suggests that selling pressure on a token is increasing, which often results in price corrections.
Read Polkadot’s [DOT] Price Prediction 2024-25
A look at Polkadot’s network activity
Not only did the token struggle in terms of price action, but we found that Polkadot’s network activity was also dwindling, as per Artemis’ data.
The blockchain’s daily active addresses declined sharply in December. Because of the decline in addresses, the blockchain’s daily transactions also followed a similar trend.

