XRP Price Faces 8% Weekly Decline with Key Support Level in Focus
12/24/2024 02:30
XRP price nears a critical $2.17 support after an 8% drop, with mixed RSI and CMF signals hinting at potential recovery or further decline.
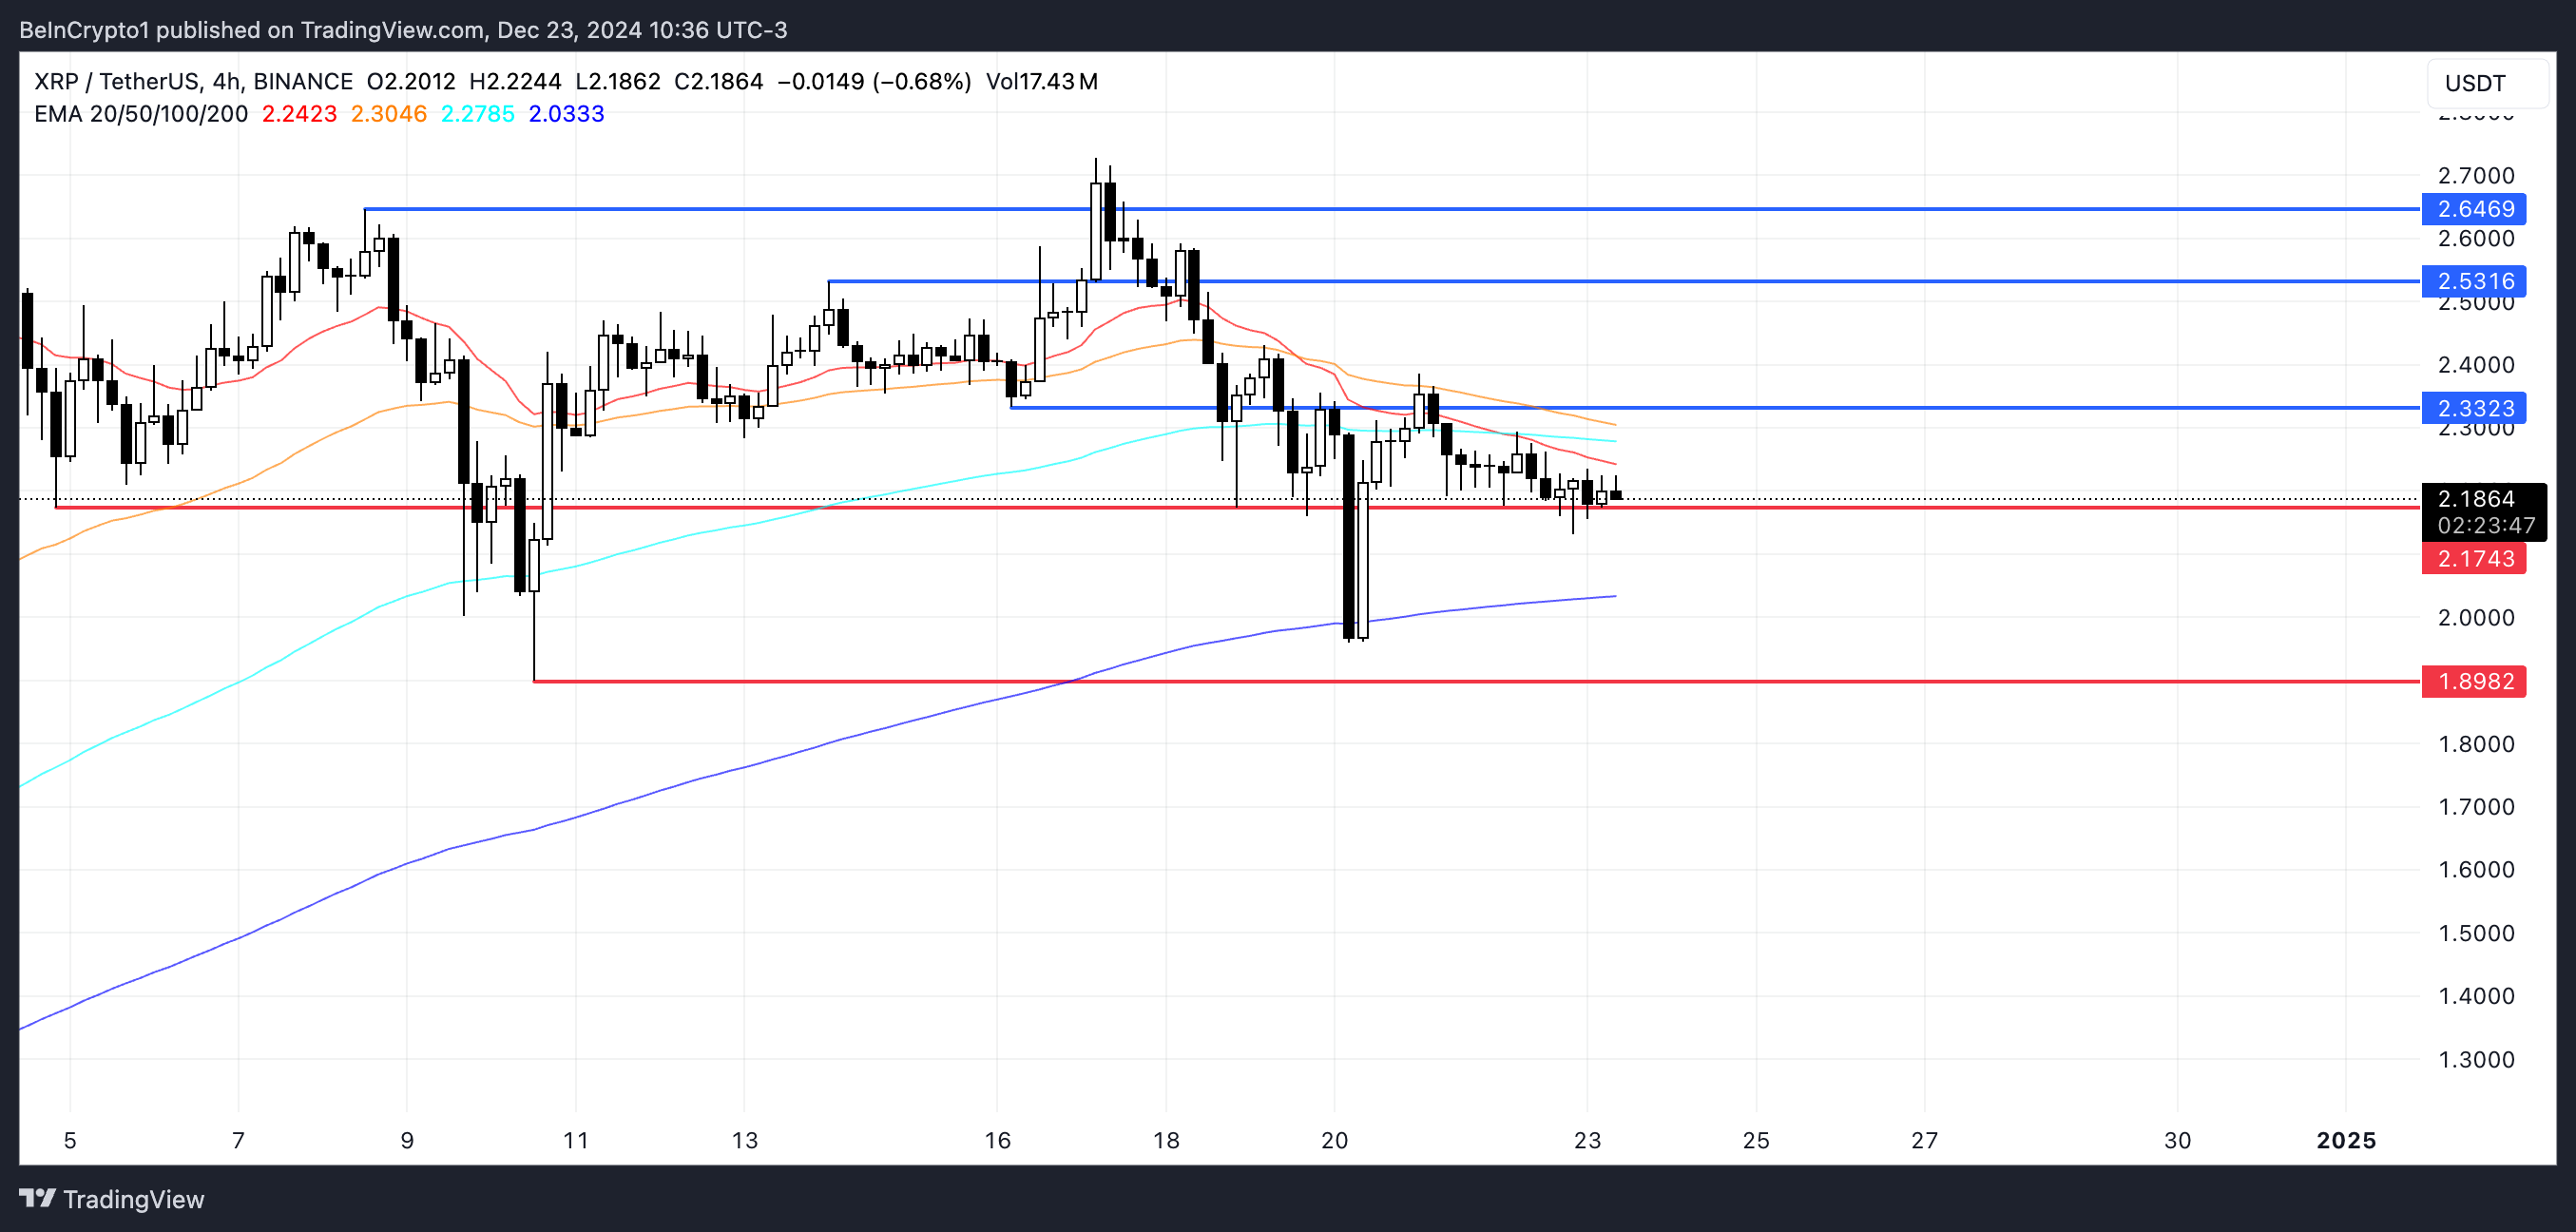
XRP price has faced a notable downturn, dropping more than 8% over the past seven days after reaching its highest levels in six years on December 17. The recent decline has brought XRP closer to a critical support level at $2.17, a key price point that could determine its short-term trajectory.
Despite this pullback, momentum indicators like RSI and CMF suggest mixed signals, with some signs of recovery but not enough to confirm a strong bullish trend. As traders watch closely, XRP’s ability to hold its support or reclaim its December uptrend will be pivotal in shaping its next moves.
XRP RSI Is Currently Neutral
The Relative Strength Index (RSI) for XRP has surged to 43.12, climbing sharply from below 20 just three days ago. This significant increase suggests a strong shift in momentum. When the RSI is below 20, it often indicates that an asset is deeply oversold, potentially signaling extreme bearish sentiment or capitulation among market participants.
The rebound to 43.12 reflects a recovery in buying interest, suggesting that traders may be stepping in at lower prices, perceiving them as an opportunity.

RSI is a momentum oscillator used to evaluate the speed and magnitude of recent price changes. It ranges from 0 to 100, with key thresholds typically at 30 and 70. Readings below 30 indicate an oversold condition, where prices may have fallen too quickly and could be due for a reversal or bounce.
Conversely, readings above 70 suggest an overbought condition, where prices may have risen excessively and could face downward pressure. XRP RSI at 43.12 places it within a neutral range, neither oversold nor overbought.
XRP CMF Is Positive, But Not That Strong
The Chaikin Money Flow (CMF) for XRP is currently at 0.04, a moderate level reflecting a slight dominance of buying pressure. This comes after it reached a high of 0.11 just a day ago, signaling stronger accumulation at that point, and a notable recovery from -0.13 on December 20, when selling pressure was dominant.
The progression from negative to positive values highlights a shift in market sentiment, with capital flow leaning towards buyers over the past few days. However, the drop from 0.11 to 0.04 suggests that while buying interest remains, it has somewhat tapered off, potentially indicating a phase of consolidation for XRP in the short term.

CMF is an indicator used to assess the strength of buying or selling pressure by analyzing both price and volume over a specific period. It ranges between -1 and +1, with positive values indicating net buying pressure and negative values reflecting net selling pressure. A CMF above 0 typically suggests that more money is flowing into the asset, indicating accumulation, while a CMF below 0 suggests distribution.
XRP current CMF of 0.04, being slightly above zero, indicates marginally stronger buying activity than selling. While it suggests ongoing interest from buyers, the decrease from 0.11 may imply a weakening of bullish momentum, which could result in sideways price movement or a need for stronger volume to sustain any upward trajectory.
XRP Price Prediction: Can XRP Price Go Below $2?
The support level at $2.17 is critical for XRP current price stability. If this level fails to hold, it could trigger a significant downside move, with the next strong support identified at $1.89. This would represent a potential 13% correction, suggesting that market sentiment could turn bearish and lead to further selling pressure.
Support levels like $2.17 often act as psychological and technical barriers that buyers defend to prevent deeper declines.

On the other hand, if XRP price can regain the uptrend it experienced at the beginning of December, when it surged to its highest levels in six years, the outlook could become much more optimistic.
A recovery of bullish momentum could see XRP first testing $2.33, a nearby resistance level. Should the uptrend strengthen, additional targets at $2.53 and $2.66 could come into play.
Disclaimer
In line with the Trust Project guidelines, this price analysis article is for informational purposes only and should not be considered financial or investment advice. BeInCrypto is committed to accurate, unbiased reporting, but market conditions are subject to change without notice. Always conduct your own research and consult with a professional before making any financial decisions. Please note that our Terms and Conditions, Privacy Policy, and Disclaimers have been updated.