Ethereum faces resistance at $3.7K: ETH can break through IF…
12/25/2024 13:00
A break below $3K could turn bearish, triggering larger sell-off whereas a sustained move above $3.7K could confirm ETH rally continuation.

Posted:
- The key support level for Ethereum was at $3K zone and the key resistance wall was at $3.7K.
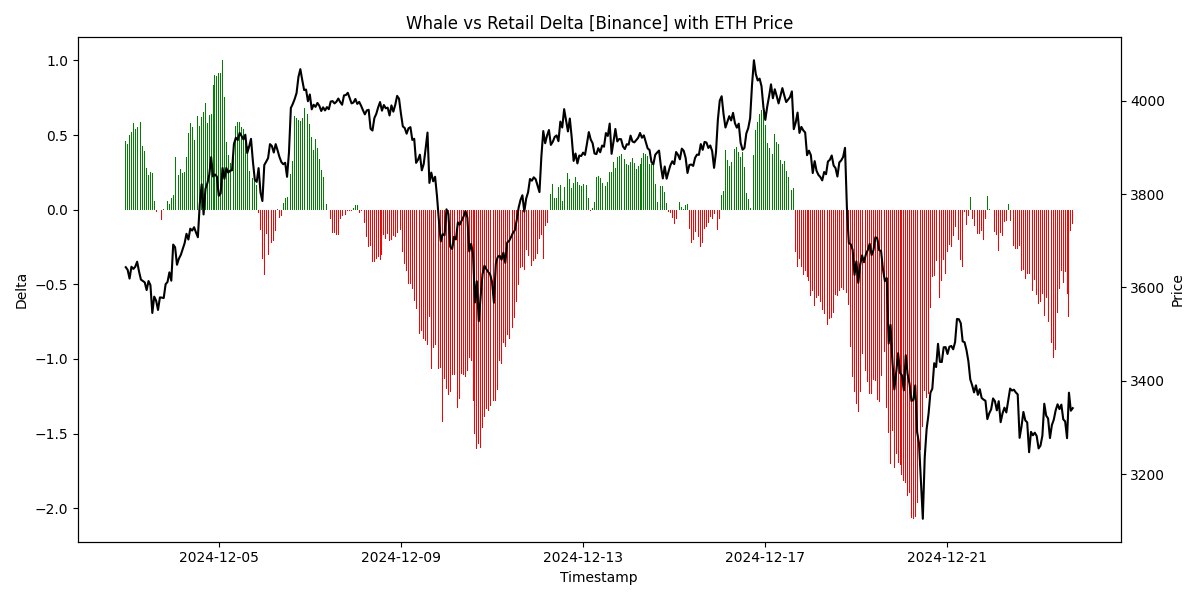
- Binance whales continue to put selling pressure on ETH as the price found a local bottom.
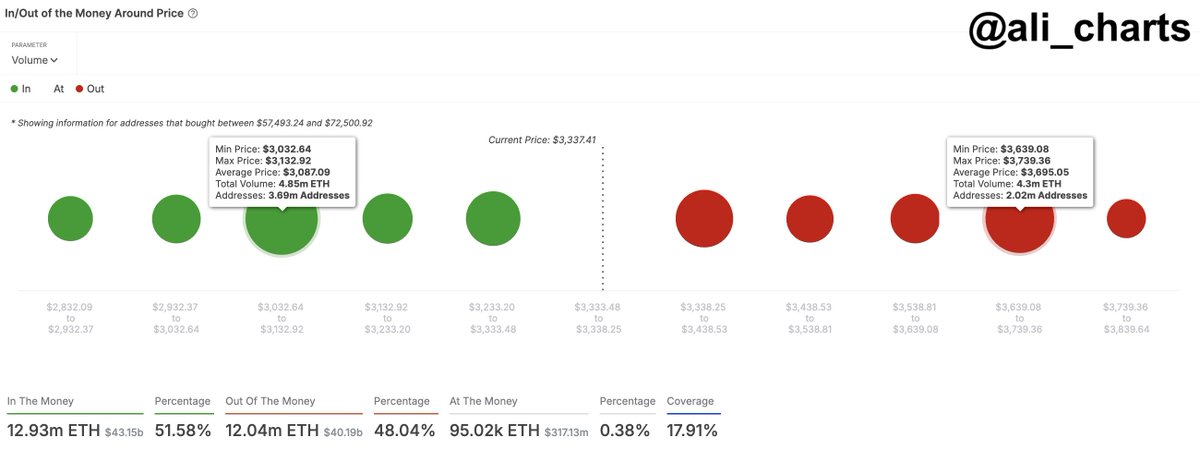
Analysis of the “In/Out of the Money Around Price” for Ethereum’s [ETH] found its most significant support between $3,030 and $3,130, a zone where a majority of holders had purchased their ETH.
The key resistance, conversely, lay between $3,640 and $3,740, beyond which a rally continuation seemed probable.
At the time of writing, 51.58% of ETH’s volume was “In the Money”, indicating profitability, whereas 48.04% was “Out of the Money,” reflecting potential selling pressure or losses at higher levels.
The narrow band of “At the Money” around the current price of $3,337.41, holding only 0.38% of volume, suggests a delicate balance. Minor price movements are likely to tip the scale.
A break below $3K could turn bearish, triggering a larger sell-off from those in loss. Conversely, a sustained move above $3.7K could confirm a bullish trend continuation, encouraging those in profits to hold for further gains.
Local bottom amid whale sell pressure?
Ethereum trends on Binance became evident that the negative whale activity corresponded closely with declining prices through December.
Specifically, during periods where delta values plummeted, significant drops in ETH followed, highlighting a potent influence of large-scale transactions on sentiment and stability.
Conversely, positive shifts in whale activities have historically suggested potential price rebounds, signaling key moments for traders to watch for trend reversals.
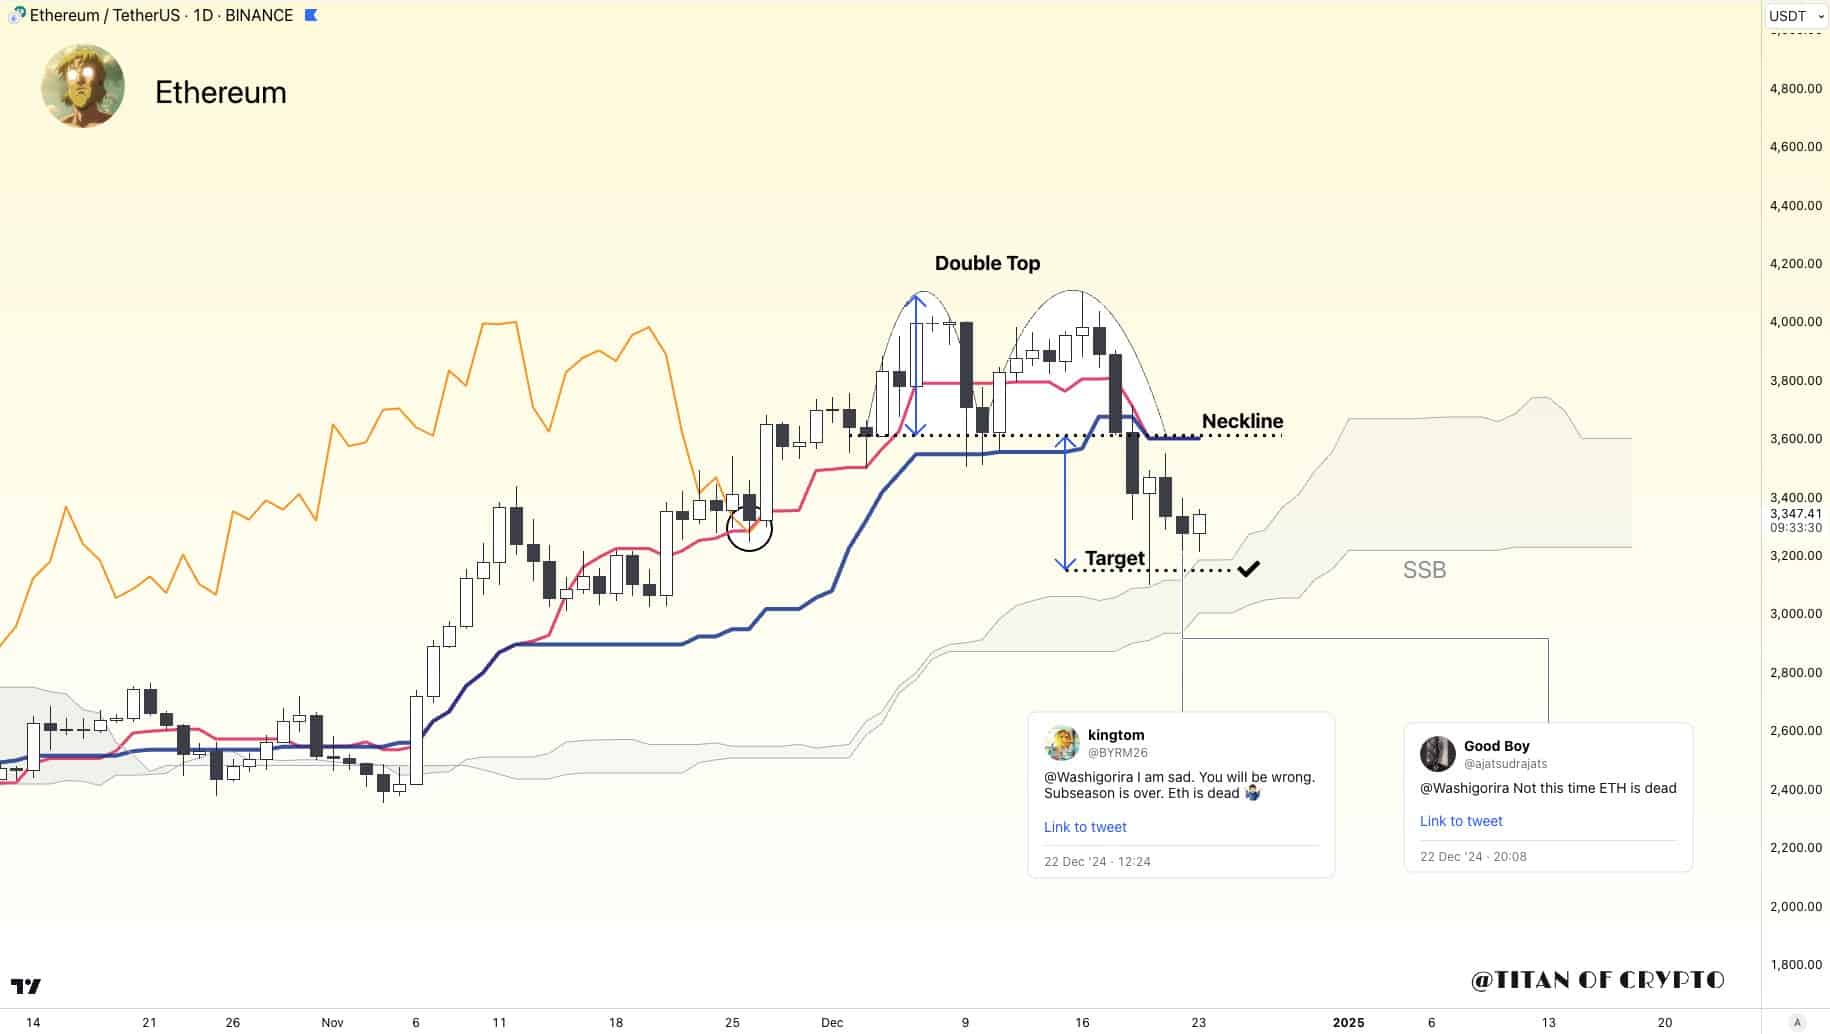
Ethereum’s price action displayed a classic double-top pattern, which is a typical reversal signal. This pattern formed peaks around $4K before sharply declining to the neckline around $3.4K, fulfilling the bearish forecast.
The subsequent drop reached a low of $3,200, hitting the pattern’s projected target. As the price touched this low, discussions about Ethereum’s vitality resurfaced, suggesting a potential local bottom formation.
Historical behavior indicated that such sentiments often preceded stabilization or reversal. If the pattern holds, ETH could see a recovery from these levels, suggesting a temporary bottom might be in place.
Spot ETH ETFs inflow
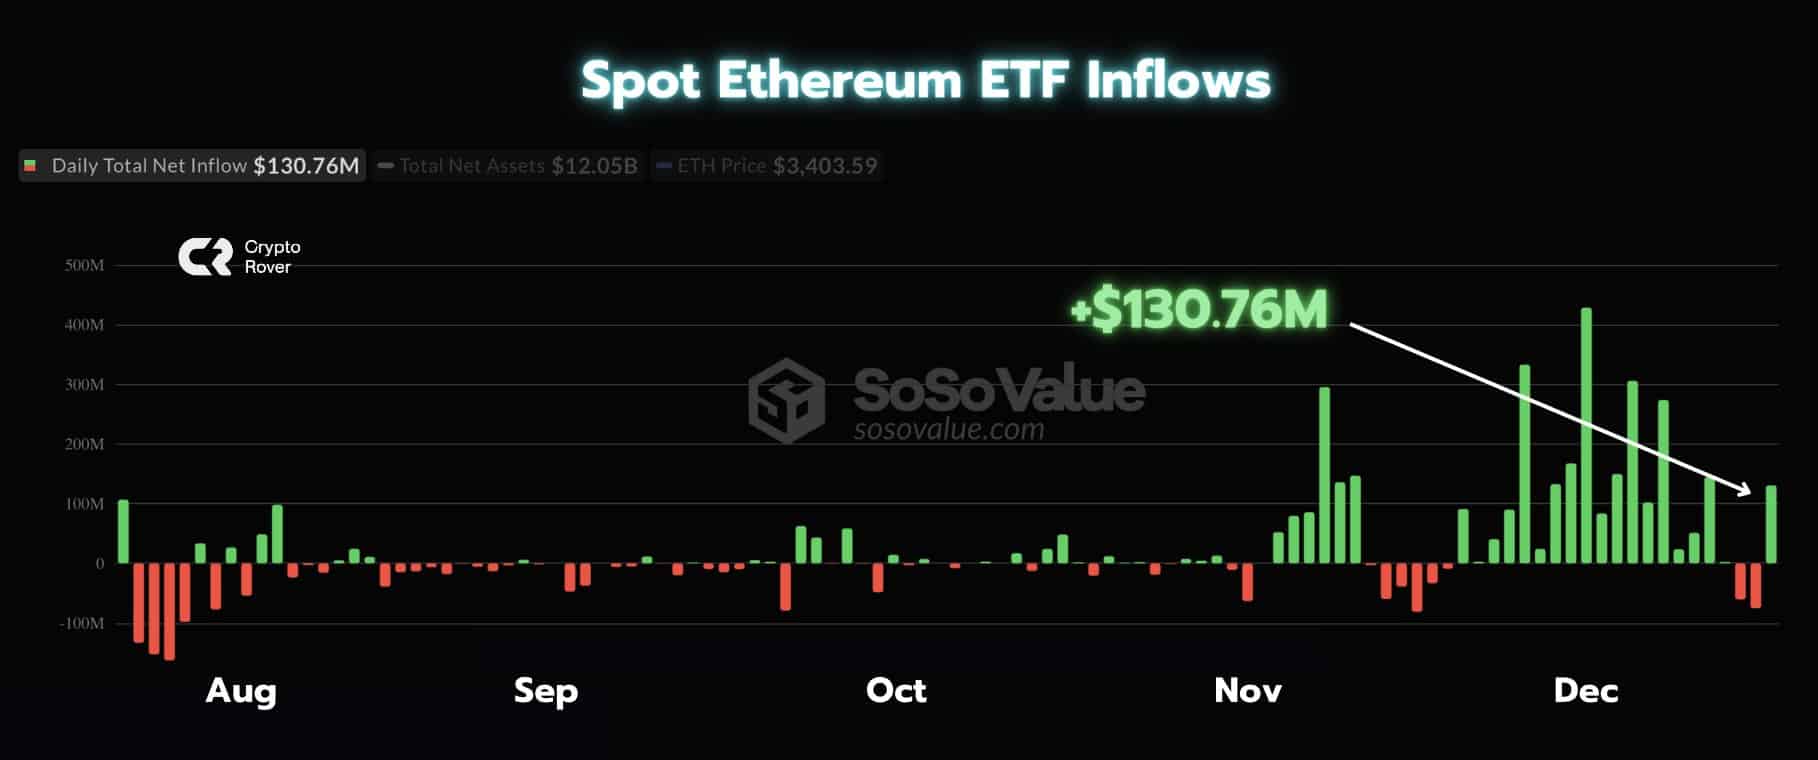
The Spot Ethereum ETF saw an influx of $130.76 million. This surge in inflows, after a period of fluctuating but generally lower volumes, marked a noticeable investor interest spike.
These robust inflows into ETH-based financial products suggested growing confidence among investors, which could potentially stabilize or even increase the asset’s price soon.
Read Ethereum’s [ETH] Price Prediction 2024-25
Historical patterns indicated that previous increases in ETF inflows were often followed by rises in ETH’s price, hinting that a similar outcome could be expected if the trend continues.
This influx, therefore, could signal a bullish sentiment, confirming the local bottom if investor interest remains sustained.


