Bitcoin’s latest 2019 ‘revisit’ – Here’s what it means for traders like you!
12/27/2024 21:00
Since hitting $102,747 a week ago, Bitcoin [BTC] has traded within a consolidation range between $97k and $92k. While market bears have...

Posted:
- Bitcoin’s realized cap hit its 2019 and March 2024 resistance levels
- Binance taker buy volume climbed to $8.3 billion too
Since hitting $102,747 a week ago, Bitcoin [BTC] has traded within a consolidation range between $97k and $92k. While market bears have attempted to retake the market and push the price down, bulls have continually resisted.
This resilience has pushed BTC to remain above $90k over the last 39 days. This market resilience can be attributed to a hike in buying activity across the board.
Bitcoin’s Realized Cap hits 2019, March 2024 levels
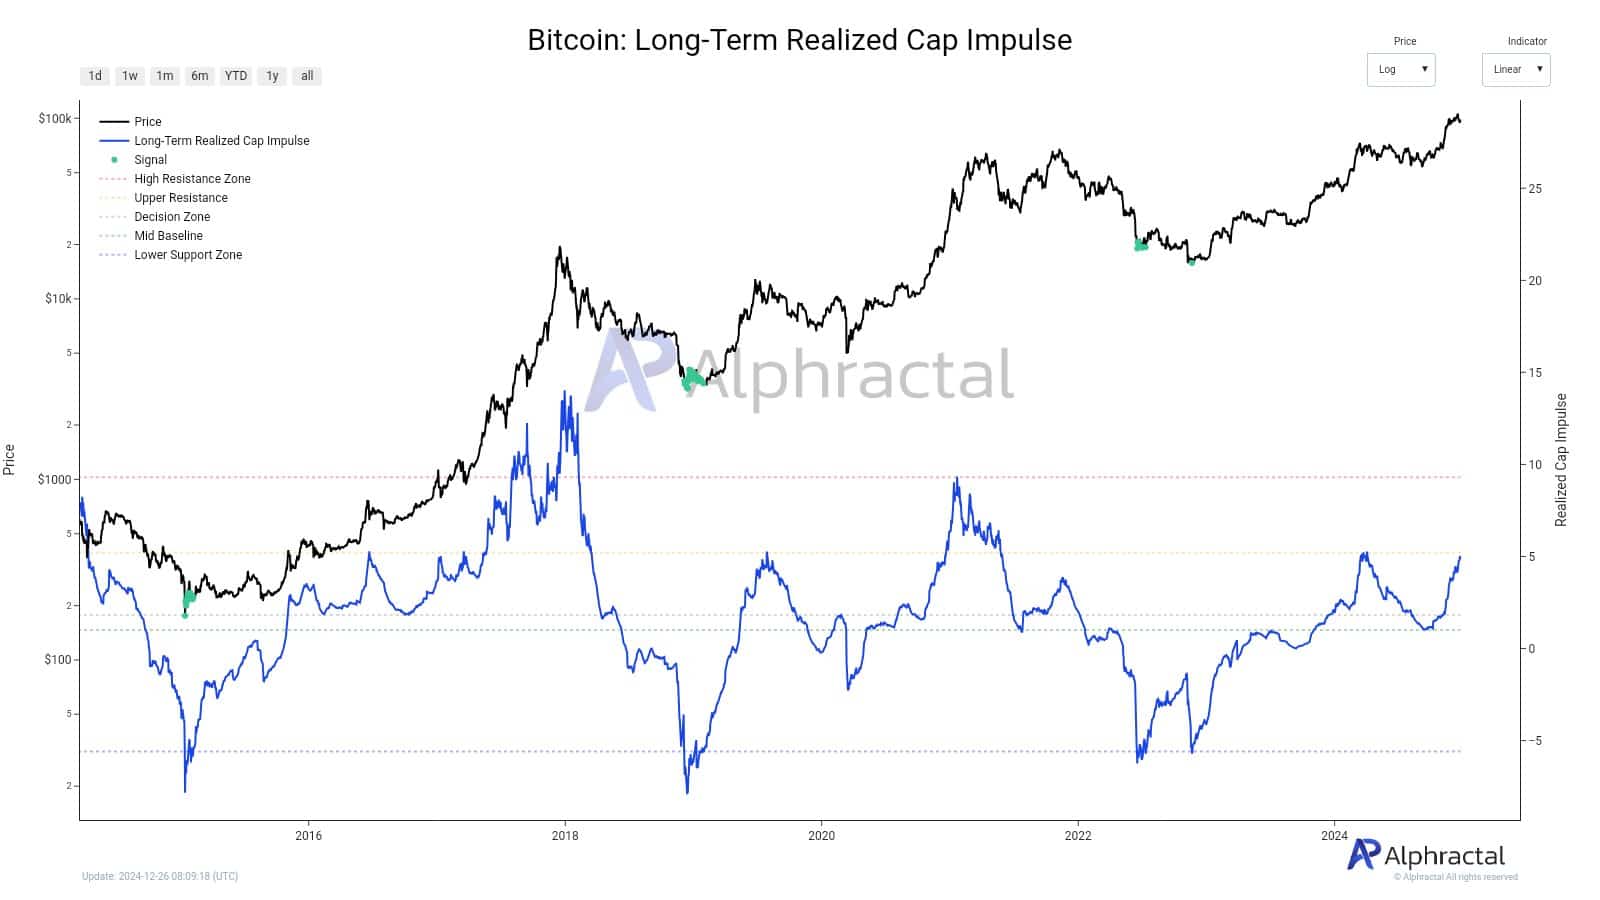
According to Alphractal’s analysis, Bitcoin’s realized capitalization reached the same resistance levels observed in 2019 and March 2024. A hike to this level can be interpreted to be a sign of sustained buying activity, especially as investors’ demand rises.
In March 2024, Bitcoin’s realized cap recorded a strong upswing while BTC’s price soared to the first ATH seen in 2024 and BTC closed the month at a high of $71k. Equally, as the market recovered from 2018’s bear market, BTC surged from $3k to $13k in 2019 between February and April. After hitting this resistance level in 2019, the prices dipped to $7k while in March, it dropped to $56k through April.
These 2 previous cycles revealed that a rise in realized cap directly correlates with BTC’s price trajectory. When it rises, it signifies a rise in buying pressure, even when the price rises higher.
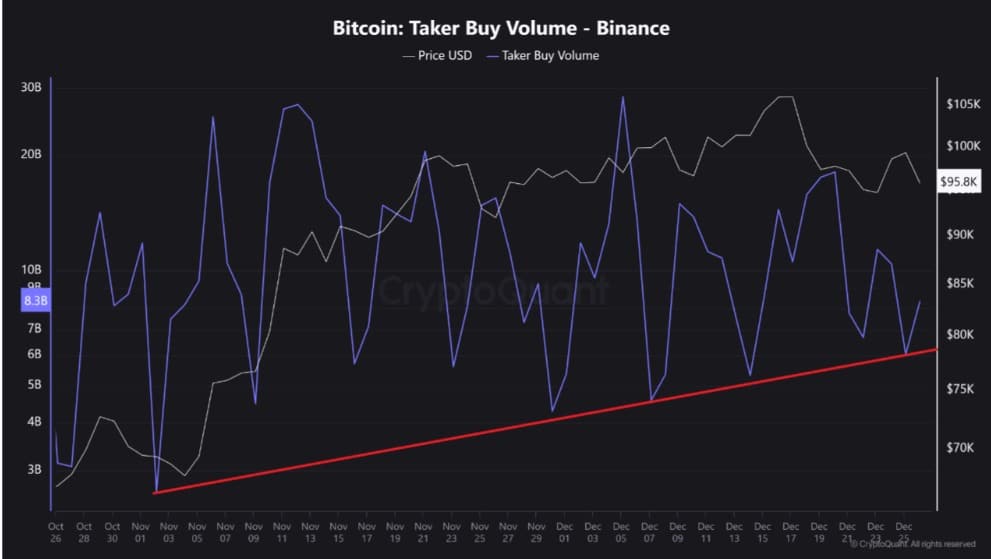
We can see this buying pressure through the recent surge in Bitcoin’s Binance taker buy volume, with the same climbing to $8.3 billion. Usually, a high taker volume points to high demand, which eventually pushes the price up.
For instance, over the last 30 days, it has made higher lows suggesting greater investor interest and strengthening buying pressure.
Based on rising buyers’ interest, we can see that the demand remains high and Bitcoin realized cap will most likely breach its previous resistance levels.
Therefore, if Bitcoin’s realized cap manages to break out from these resistance levels seen in 2019 and 2024, BTC will rise further. If it fails to do so, it will eventually decline – A sign that Bitcoin’s yearly growth has already been significant.
What do BTC’s charts suggest?
While the analysis provided seemed to offer a positive outlook, it’s essential to examine and determine what other market indicators say.
According to AMBCrypto’s analysis, Bitcoin is currently noting strong market demand.
For starters, we can see this demand through the sustained decline in spot netflows. Over the past month, figures for the same declined from $597 million to $-334.1 million. This suggested that demand may be outpacing supply, with investors continually accumulating.
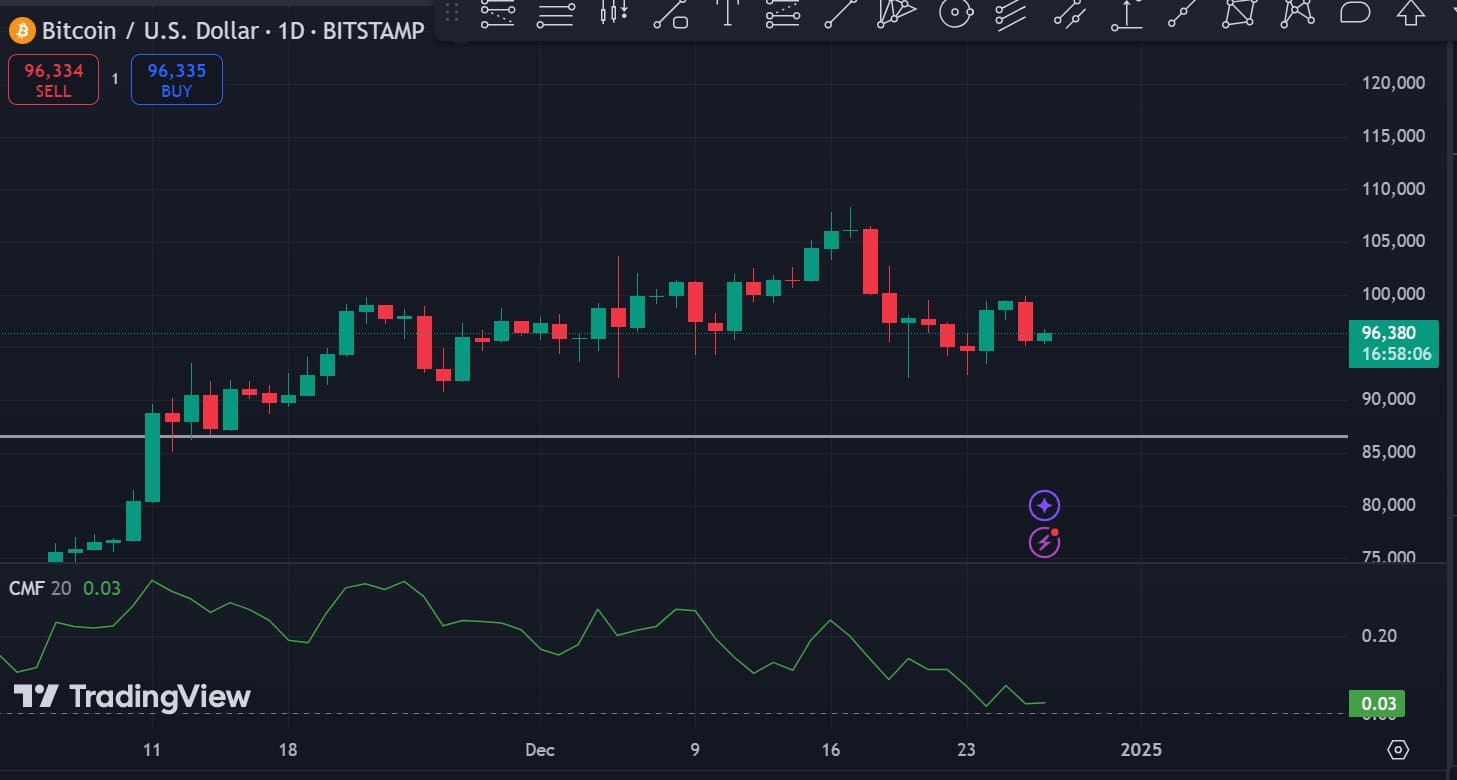
Additionally, we can see higher buying pressure through a positive Chaikin money flow (CMF). This has remained positive from November – A sign of strong demand for the crypto as investors continue to enter the market.
Simply put, although Bitcoin’s realized cap has reached its previous resistance level, BTC’s demand remains significant. This means that Bitcoin has more room for growth. If this demand remains and buying pressure pushes the price higher, BTC will attempt $98,900 in the short term.
However, if the yearly growth is already done, Bitcoin could start declining to $92,200.


