Will Bitcoin bears pull it down to $60K? Analyst shares signs of possible correction
12/28/2024 07:00
Bitcoin [BTC] has been struggling over the past week as the coin’s price didn’t manage a breakout, but will this trend last?

Posted:
- Several crypto analysts are predicting a price drop
- However, a buy signal flashed on the cryptocurrency’s chart
Bitcoin [BTC] has been struggling over the past week, with the crypto’s price unable to register a major breakout. In fact, according to some analysts, BTC’s latest bearish price action could underline the possibility of BTC once again falling to $60k.
Will Bitcoin bears push BTC to $60k again?
CoinMarketCap’s data revealed that BTC’s price has only moved marginally in the last seven days, with its value climbing only by a modest 2%. At the time of writing, Bitcoin was trading at $96,158.09 with a market capitalization of over $1.9 trillion.
In light of the crypto’s price action, Ali, a popular crypto analyst, shared a tweet, revealing quite a few intriguing predictions. One of them from Peter Brandt claimed that BTC “could be about to break down of a broadening triangle,” projecting a retracement towards the $70,000 zone.
According to Martinez, from an on-chain perspective, a Bitcoin price correction to $70,000 is possible. Especially since below $93,806, it is pretty much open air all the way down to $70,085.
Where is BTC heading?
AMBCrypto then assessed the king coin’s on-chain data to find out the likelihood of it falling to $60k again. Glassnode’s data revealed that BTC’s market bottom was higher than $60k.
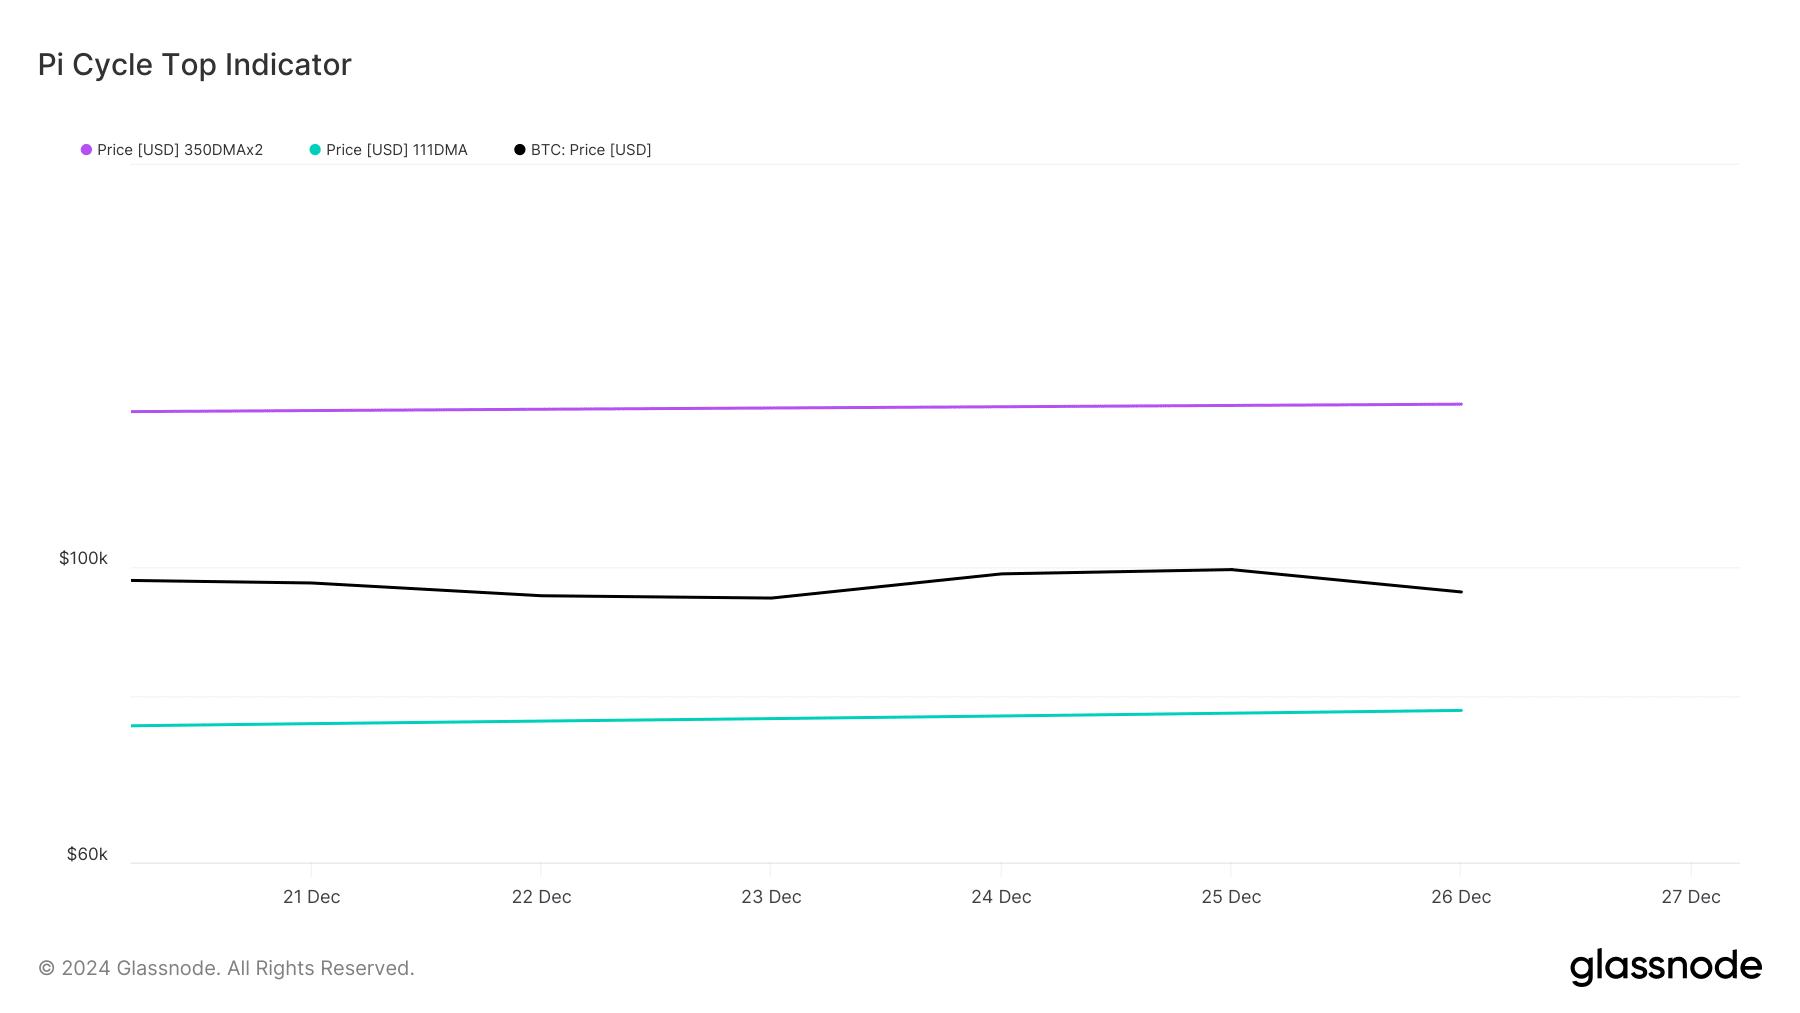
As per the Pi Cycle Top indicator, BTC’s possible market bottom was at $78k. On the other hand, the king coin’s possible market top could be near $132k, as per the same indicator.
At the time of writing, BTC’s price was still in the neutral zone, as per the fear and greed index. This means that the coin’s price can move in any direction in the coming days or weeks.
Meanwhile, Ali Martinez posted yet another tweet suggesting a possible buy signal. The tweet mentioned that the TD Sequential presented a buy signal on the Bitcoin hourly chart, anticipating a price rebound.
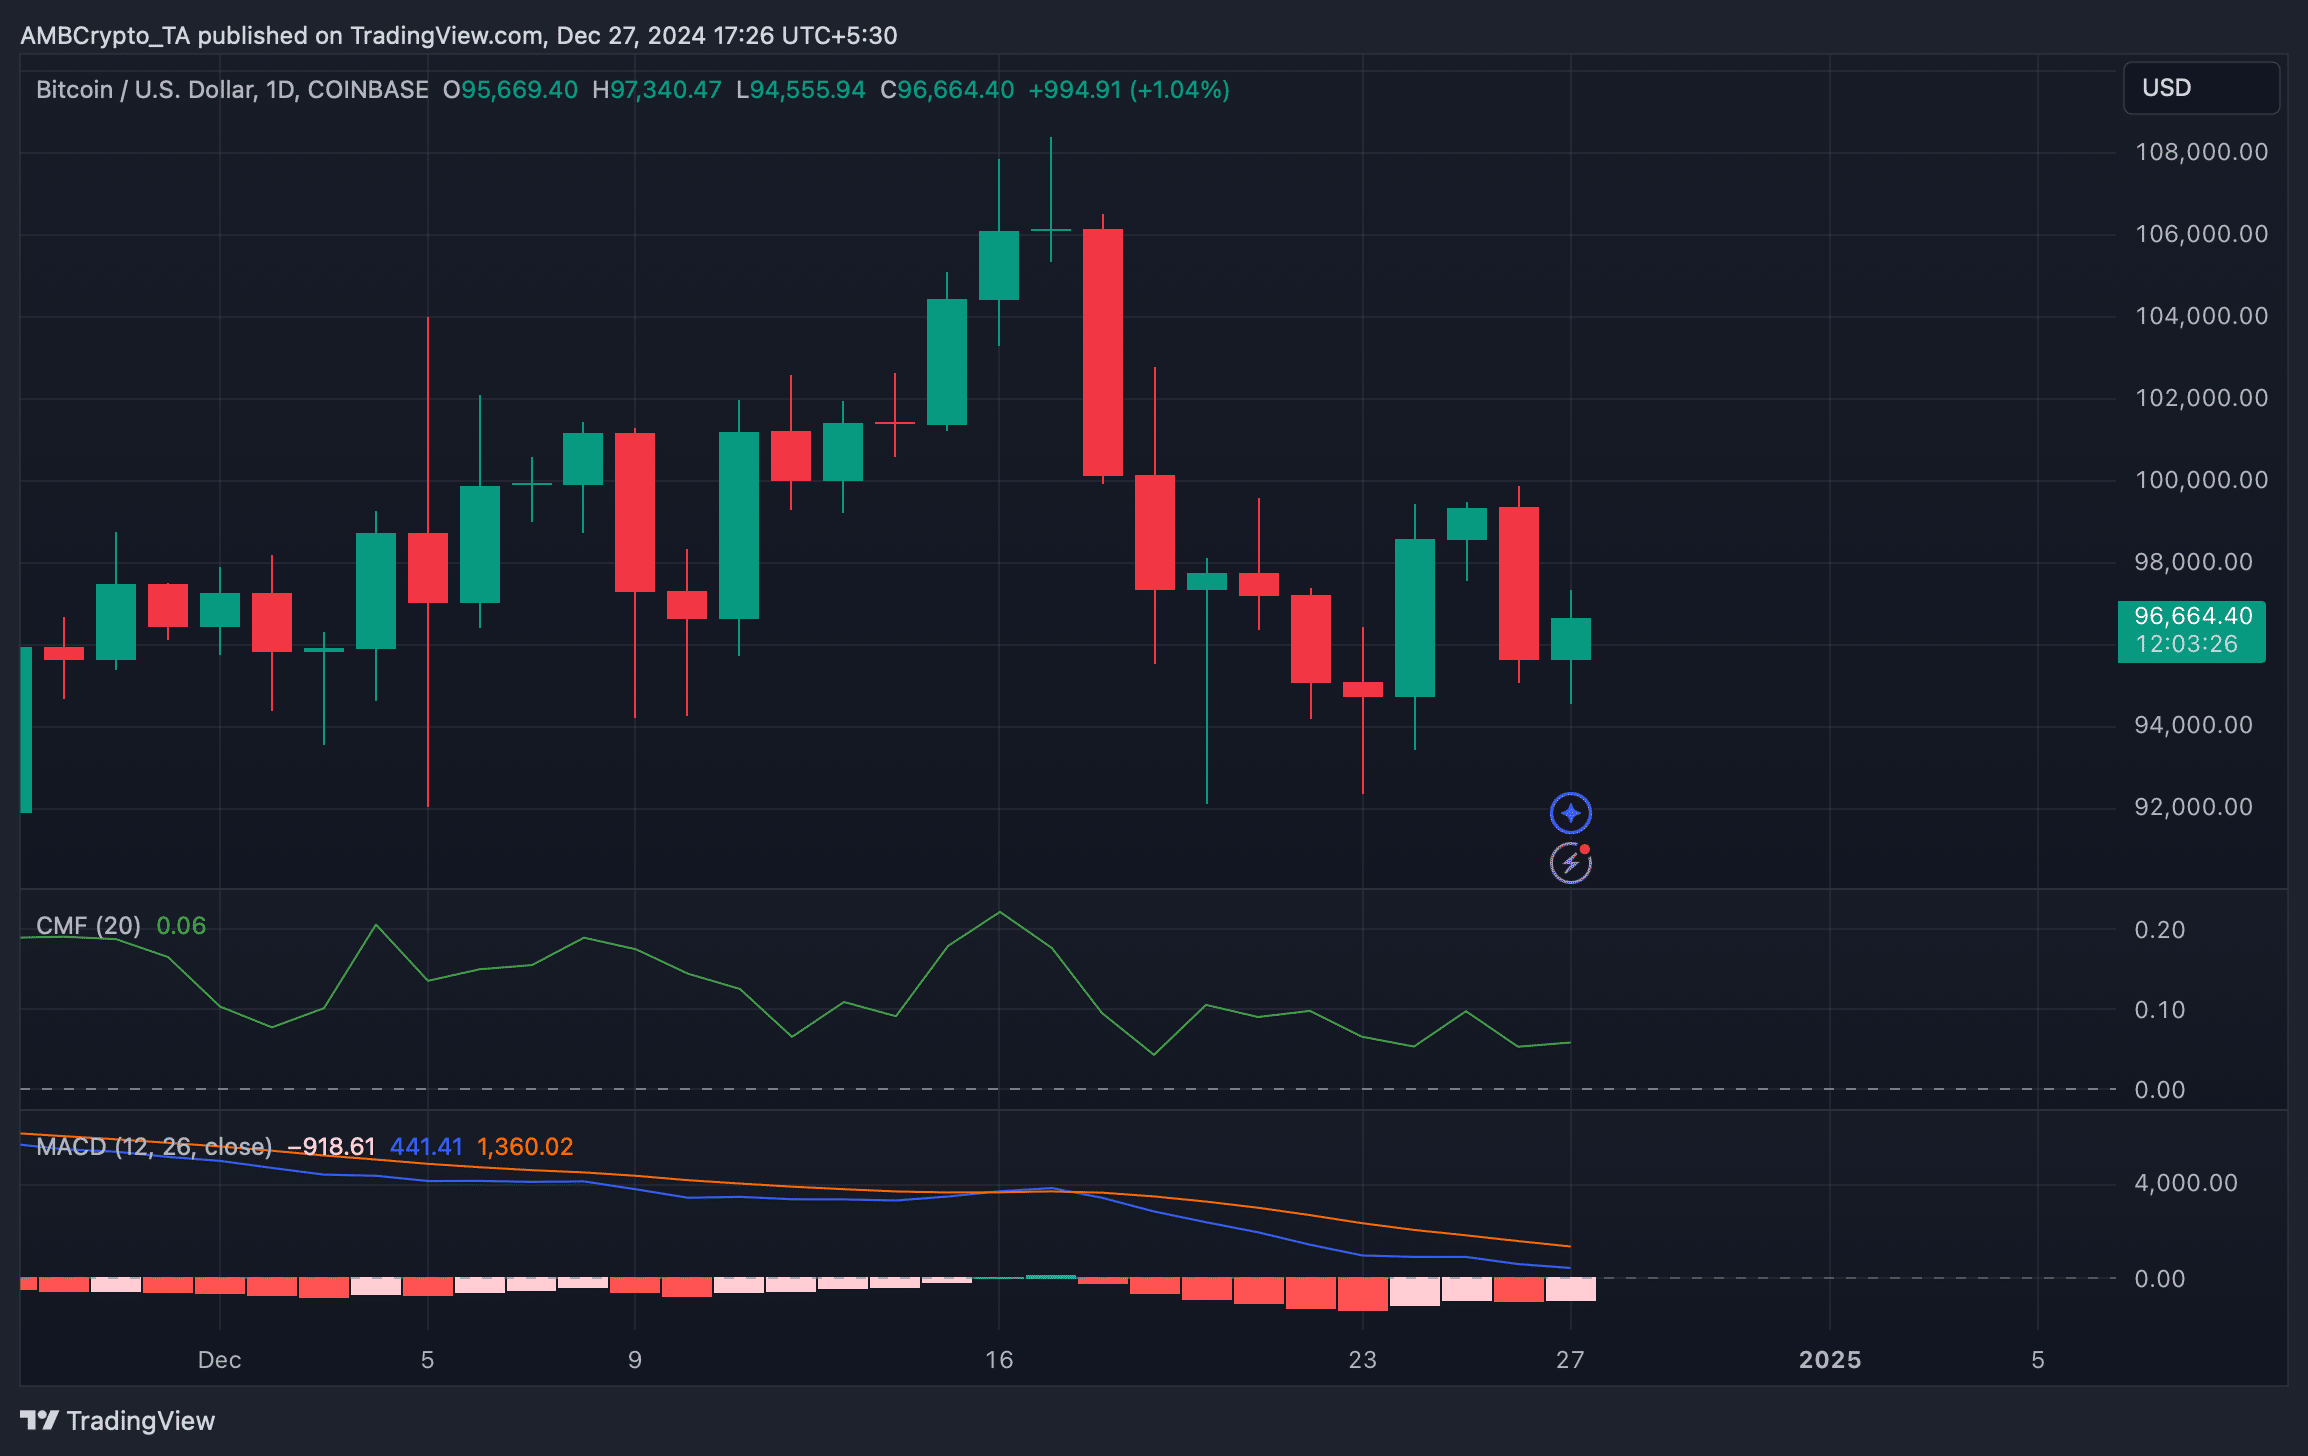
Therefore, we took a closer look at BTC’s daily chart. However, the technical indicator MACD flashed a bearish advantage in the market. This can cause a price correction, which can push the coin’s price to $60k again.
Read Bitcoin’s [BTC] Price Prediction 2025–2026
Nonetheless, the Chaikin Money Flow (CMF) registered a slight uptick. A rise in the metric indicates a hike buying pressure and a potential uptrend. Whenever buying pressure rises, it hints at a possible price hike.

