Bitcoin (BTC): This Breakout Opens $100,000, Major Dogecoin (DOGE) Reversal Pattern Here, Solana (SOL) Bounces Off: But What's Next?
01/16/2025 07:01
Market has tried to recover, but it won't be that easy

Disclaimer: The opinions expressed by our writers are their own and do not represent the views of U.Today. The financial and market information provided on U.Today is intended for informational purposes only. U.Today is not liable for any financial losses incurred while trading cryptocurrencies. Conduct your own research by contacting financial experts before making any investment decisions. We believe that all content is accurate as of the date of publication, but certain offers mentioned may no longer be available.
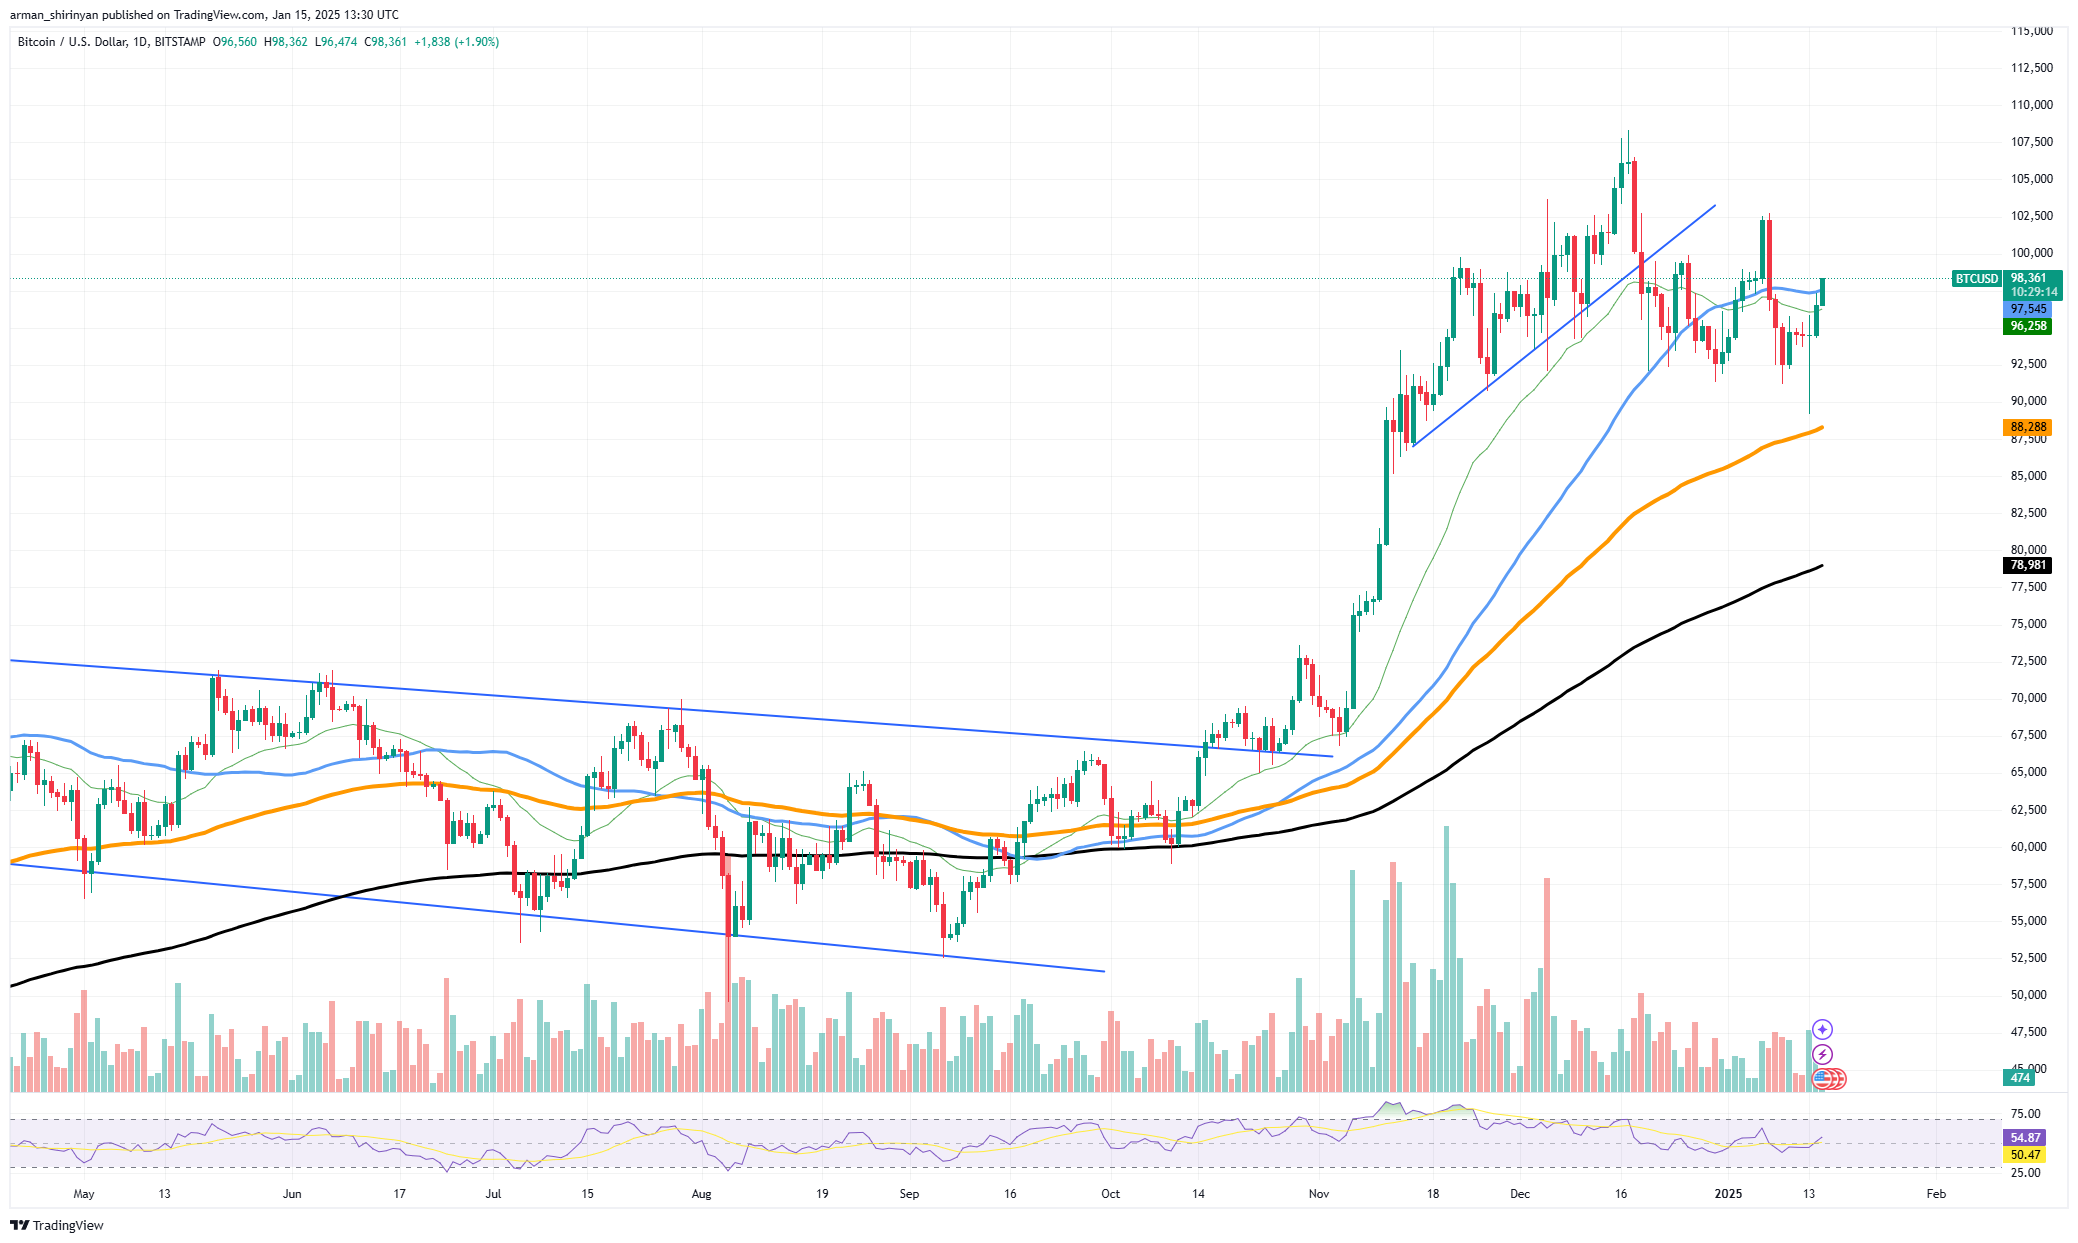
Analysts and traders are feeling more optimistic as a result of Bitcoin's recent price performance. Following a period of consolidation, the asset is now exhibiting signs of strength, with the daily chart's 50 EMA breakthrough laying the groundwork for a possible rally toward the highly anticipated $100,000 mark.
Historically, the 50 EMA level has been a crucial threshold for the price movement of Bitcoin. A change in momentum is indicated by its most recent breach, which is a bullish signal. Bitcoin has successfully recovered a position above the current price around $97,000, boosting confidence for future upward movement. Buyers have continuously intervened to defend the price in the chart's strong support zone, which is located around $88,000.

Together with the 200 EMA serving as a long-term support, this level has given Bitcoin a solid basis on which to grow. One of the main psychological obstacles on the resistance side is still $100,000. The rally would likely be further fueled if this level were successfully breached, as it would likely draw greater institutional and retail interest.
Volume indicators support the bullish breakout narrative by indicating a rise in buying activity. There may be more growth possible before the asset is overbought, as indicated by the RSI's tilt toward the higher end of the neutral zone. Despite the apparent optimism on the market right now, it is crucial to take possible risks into account.
The bullish momentum could be tempered if the price is unable to hold above the 50 EMA and a retest of lower support levels occurs. Nonetheless, the long-term outlook is still favorable as long as Bitcoin stays above $88,000.
Dogecoin's reversal possibilities
With a bullish pattern emerging on the daily chart, Dogecoin is displaying indications of a possible significant reversal. According to technical analysis, a head-and-shoulders-like structure that is usually linked to trend reversals is emerging based on price action. As Dogecoin tries to reverse its recent downward trend, this could be a crucial time. DOGE is currently trading at about $0.35 after recovering from recent lows of about $0.30, where it found support at the 100 EMA.
A change in sentiment is indicated by the formation of this support and growing buying interest. The 50 EMA is a crucial technical level that frequently denotes renewed strength, and DOGE has regained its position above it. Additionally, the chart shows improving volume trends, which suggests that traders are starting to support the recovery.
The $0.38 level, which DOGE must also overcome for confirmation, is the neckline of the possible reversal pattern. Dogecoin may move toward $0.42 and higher with a clear breakout above this level, paving the way for a longer bullish move. But until a distinct breakout happens, the scenario remains cautious.
If the neckline is not broken, there may be consolidation or even a retest of the 200 EMA near $0.25 or lower support levels around $0.30. A spike in purchasing activity during the breakout would confirm the bullish outlook, so traders should keep a close eye on volume.
Solana recovers
Solana has demonstrated tenacity by recovering from its 200 EMA support level at $179. Because it indicates that the market has recognized this crucial support zone, this technical rebound is an important move for the asset. Still, the more general query is: what will happen to Solana next?
In technical analysis, the 200 EMA is typically thought of as a last-resort support level, so SOL's ability to bounce back from it is encouraging. The price has rebounded above $189, which is a positive development. The recovery is also accompanied by a discernible increase in purchasing volume, which suggests that market players are once again interested.
Looking ahead, the 50 EMA and 100 EMA converge at the $195-$200 range, which is the immediate resistance. A test of higher levels close to $210, which would indicate a more definite change in momentum, could be possible if there is a breakout above this zone. A daily close above the 200 EMA is essential for bullish continuation because a decline below it could start a protracted bearish trend.
Conversely, if this rebound is not maintained, SOL may retest the $179 mark. In addition to endangering the recent recovery, a break below the 200 EMA would also suggest the start of a longer-term downtrend. Although there is still potential for movement in either direction due to the RSI's neutrality, buyers must sustain the current momentum to keep the outlook optimistic.
Disclaimer: The opinions expressed by our writers are their own and do not represent the views of U.Today. The financial and market information provided on U.Today is intended for informational purposes only. U.Today is not liable for any financial losses incurred while trading cryptocurrencies. Conduct your own research by contacting financial experts before making any investment decisions. We believe that all content is accurate as of the date of publication, but certain offers mentioned may no longer be available.

