SHIB Price Analysis for October 19
10/20/2023 01:00
How long is drop of SHIB going to last?
Disclaimer: The opinions expressed by our writers are their own and do not represent the views of U.Today. The financial and market information provided on U.Today is intended for informational purposes only. U.Today is not liable for any financial losses incurred while trading cryptocurrencies. Conduct your own research by contacting financial experts before making any investment decisions. We believe that all content is accurate as of the date of publication, but certain offers mentioned may no longer be available.
Most of the coins are in the red zone, according to CoinStats.

SHIB/USD
The rate of SHIB has declined by 1.80% over the last day.

On the hourly chart, traders should focus on the local resistance level of $0.00000676.
If the bar breaks it and fixes above, one can expect a further upward move to the $0.00000690 area.
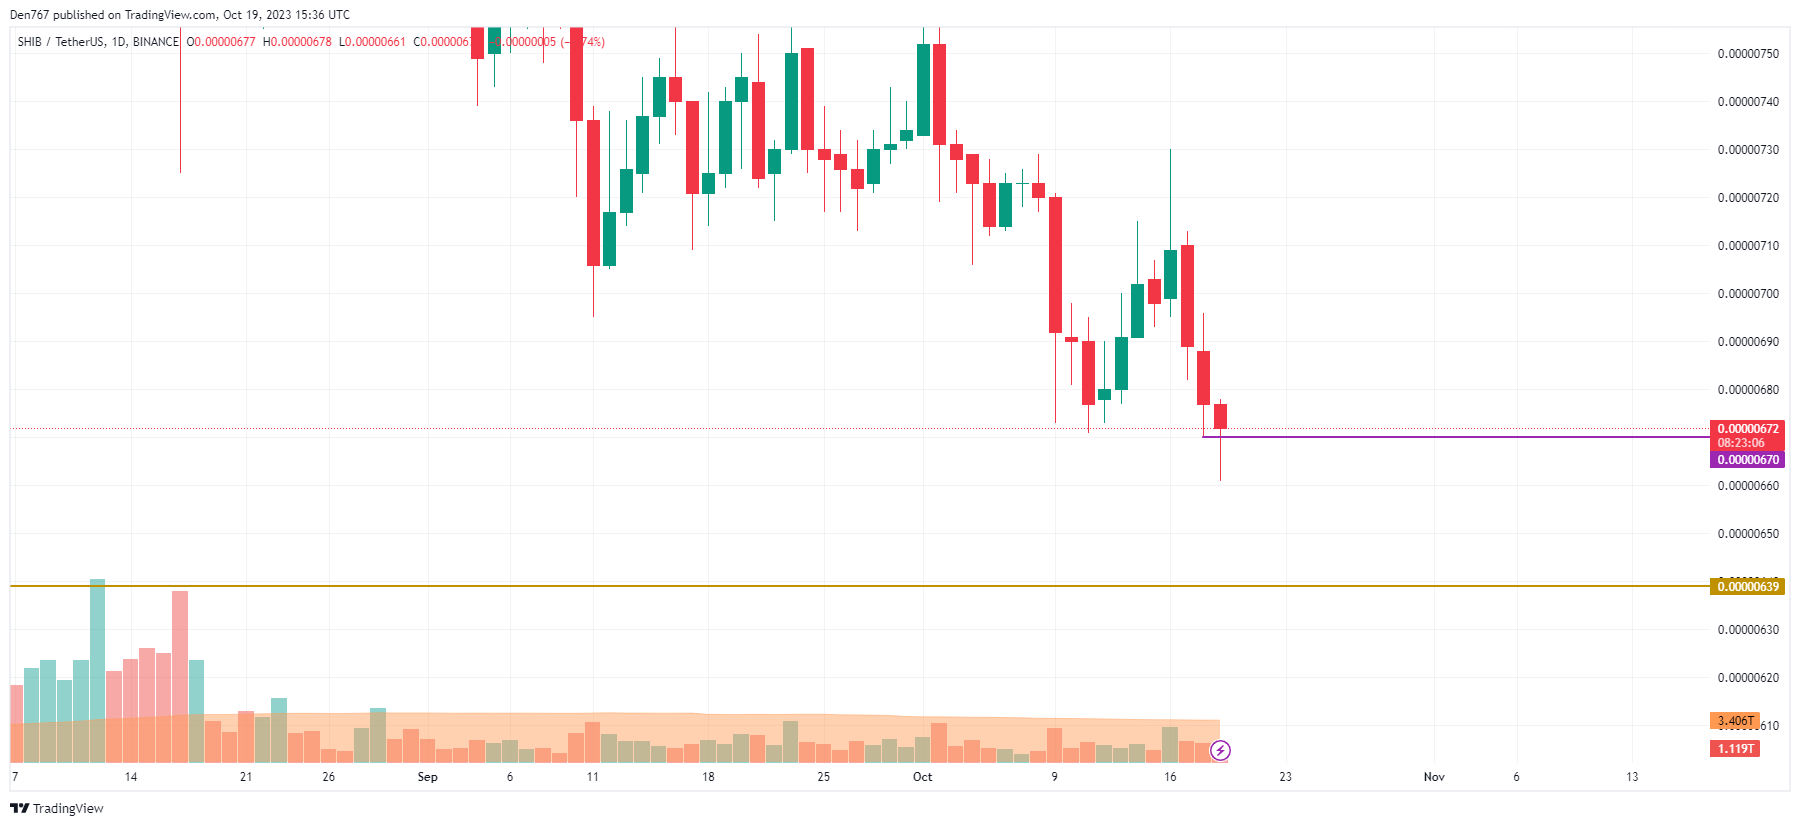
On the daily time frame, traders should focus on the bar closure in terms of yesterday's bar low. If a false breakout happens, there is a possibility to see a local correction to the $0.0000069-$0.0000070 zone soon.
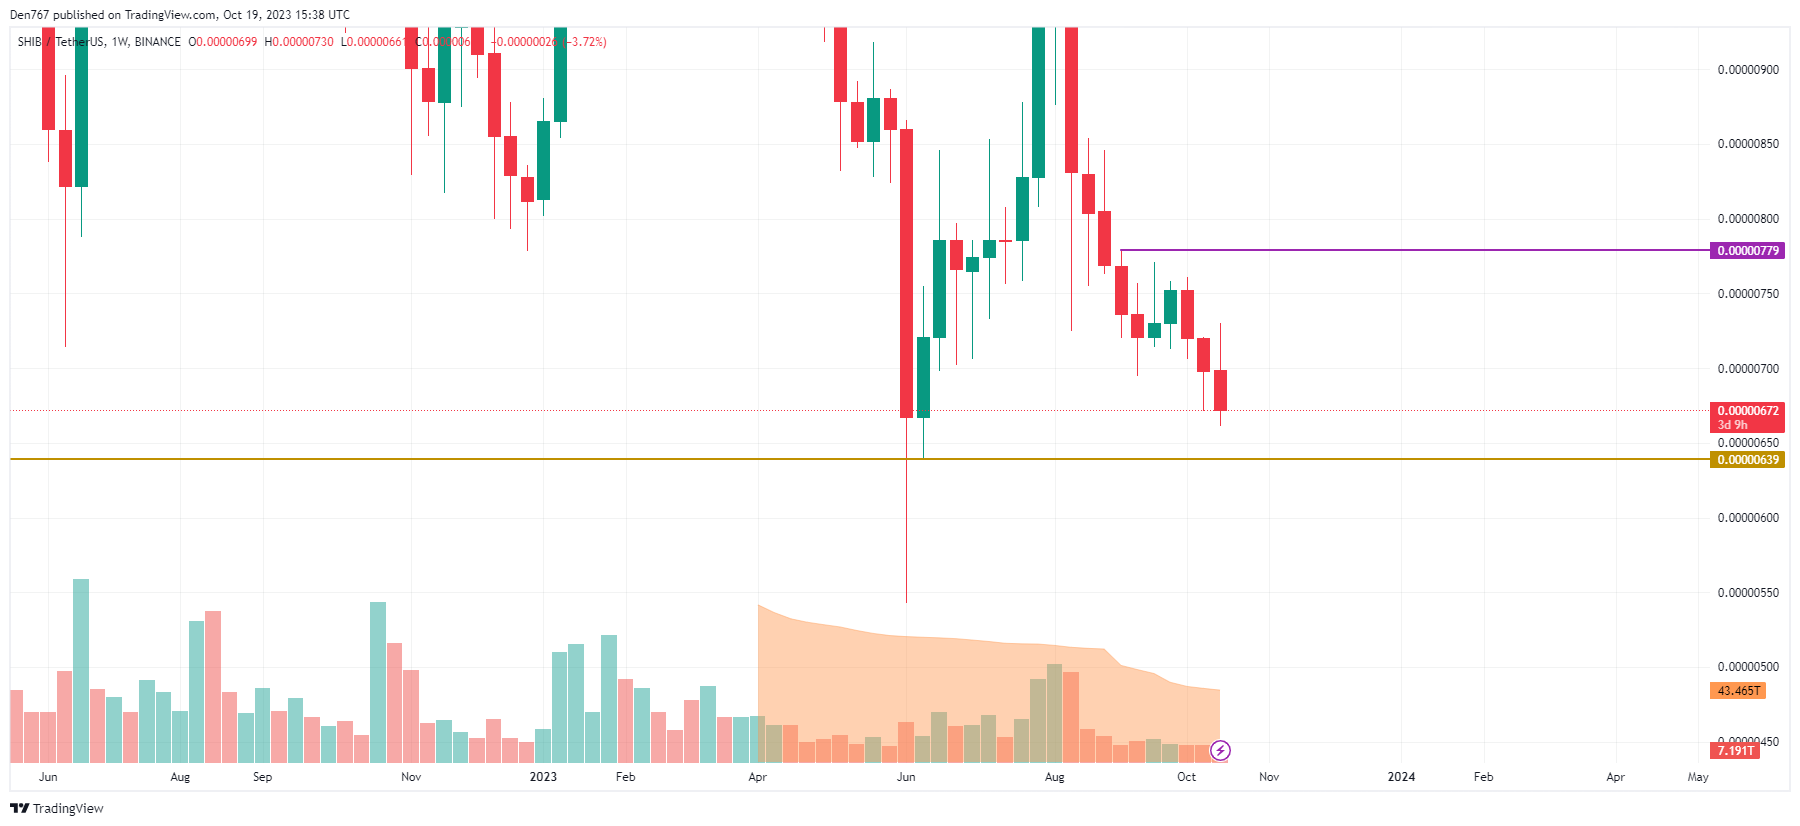
A bearish picture remains on the weekly chart. If the bar closes with no long wick, the decline will likely continue to the support level of $0.00000639.
SHIB is trading at $0.00000673 at press time.
About the author

Denys Serhiichuk
With more than 5 years of trading, Denys has a deep knowledge of both technical and fundamental market analysis. Mainly, he has started his blog on TradingView where publishes all relevant information and makes predictions about top coins.
Thus, his experience is backed up by working in top blockchain related companies such as W12, Platinum Listing, ATB Coin, and others, can be contacted at [email protected].