XRP Price Analysis for December 17
12/18/2023 01:00
How long will sideways trading of XRP last?
Original U.Today article
Disclaimer: The opinions expressed by our writers are their own and do not represent the views of U.Today. The financial and market information provided on U.Today is intended for informational purposes only. U.Today is not liable for any financial losses incurred while trading cryptocurrencies. Conduct your own research by contacting financial experts before making any investment decisions. We believe that all content is accurate as of the date of publication, but certain offers mentioned may no longer be available.
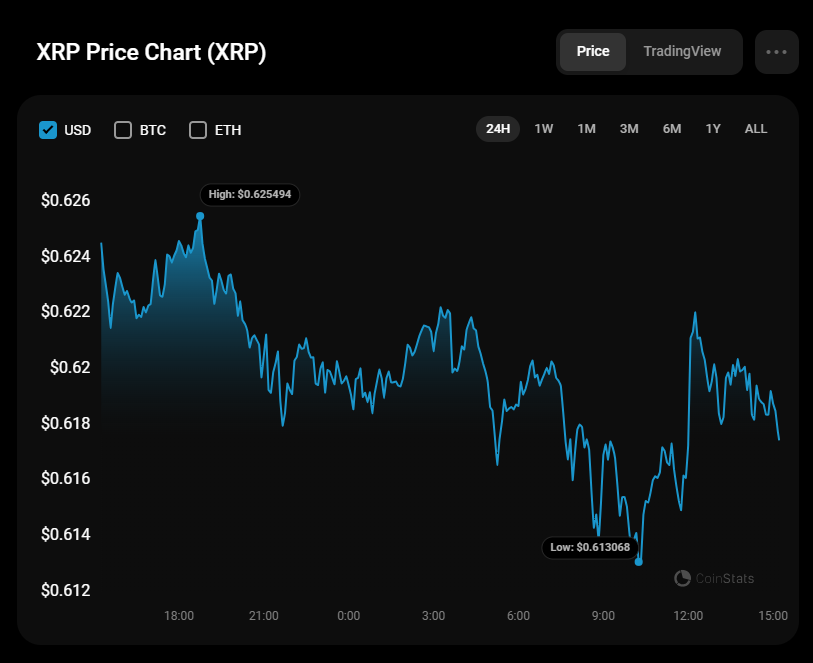
Most coins are facing corrections, according to CoinStats.
XRP/USD
The rate of XRP has fallen by 1.19% over the last 24 hours.
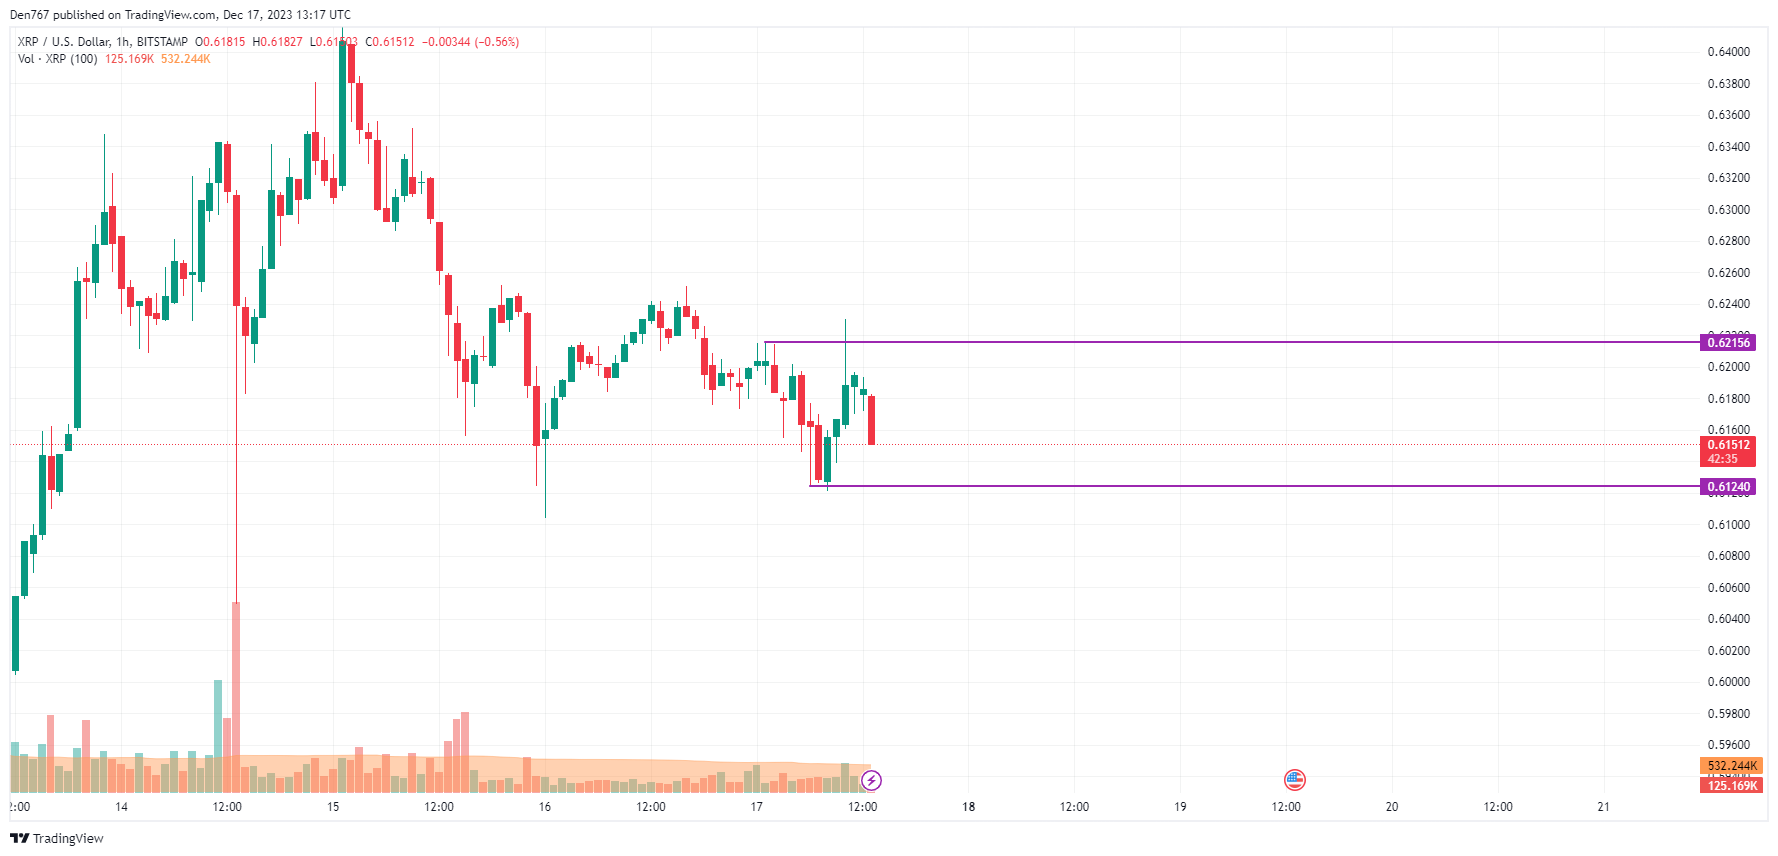
On the hourly chart, the price of XRP is falling after a false breakout of the resistance level at $0.6215. If nothing changes by the end of the day, there is a high chance of a drop to the $0.61 area.
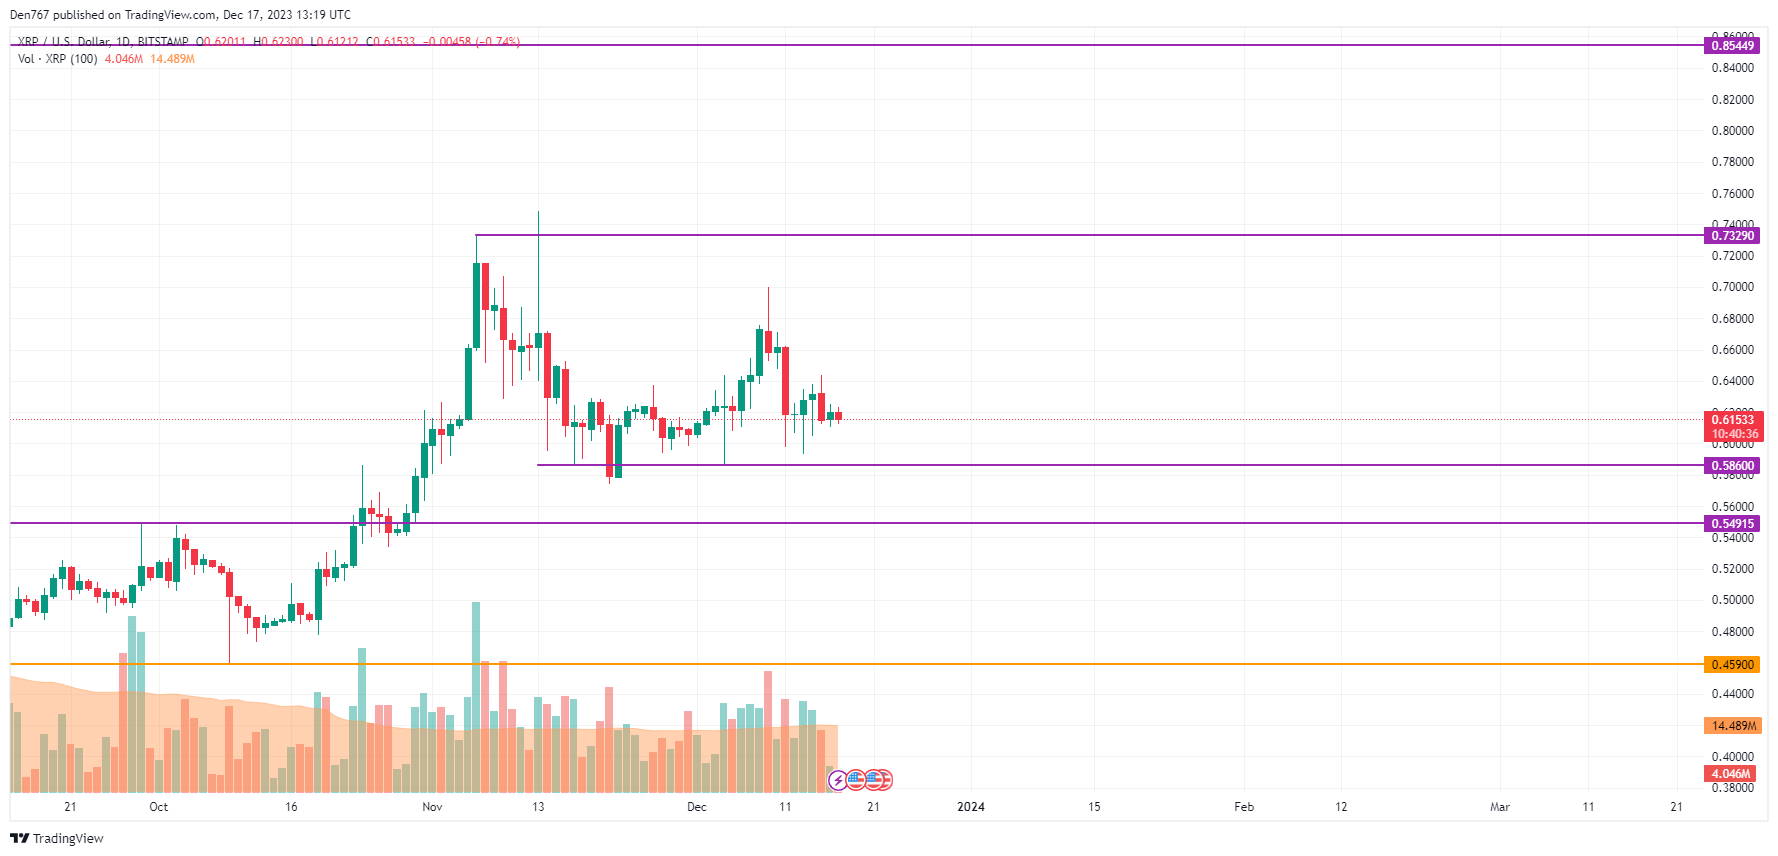
On the bigger time frame, the rate of XRP remains more bearish than bullish as the price has not returned to the $0.64 zone.
If the situation does not change, traders may expect a test of the support level at $0.5860.
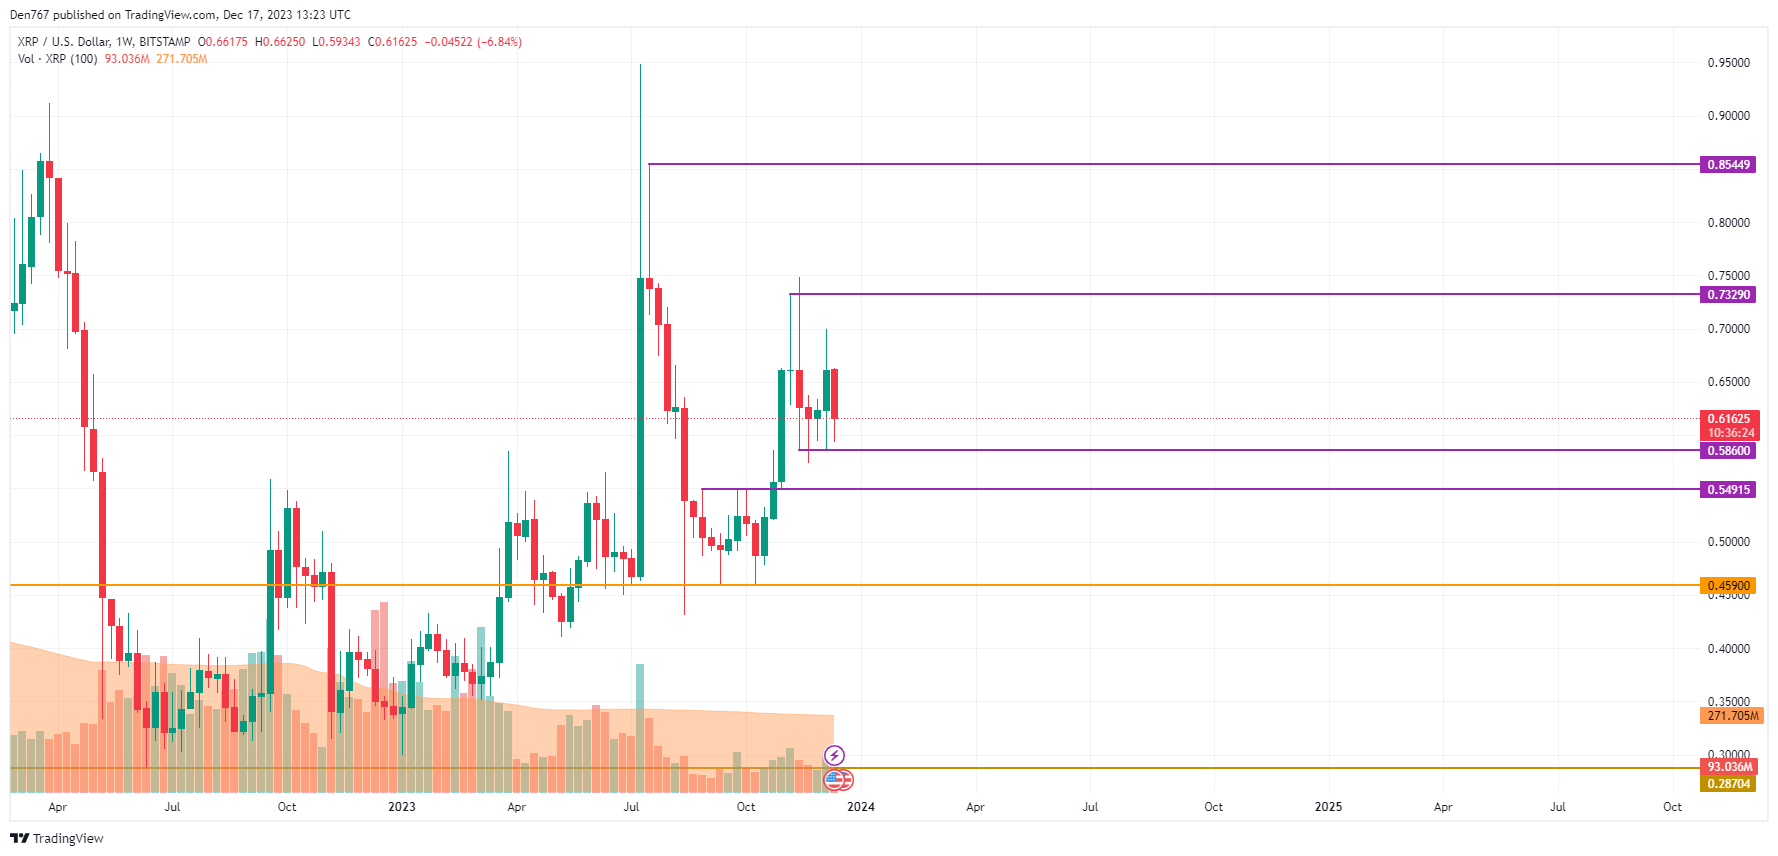
A similar picture is on the weekly chart. If the bar closes near the support, one can see a breakout followed by a decline to the $0.55 zone by the end of the month.
XRP is trading at $0.61625 at press time.
About the author

Denys Serhiichuk
With more than 5 years of trading, Denys has a deep knowledge of both technical and fundamental market analysis. Mainly, he has started his blog on TradingView where publishes all relevant information and makes predictions about top coins.
Thus, his experience is backed up by working in top blockchain related companies such as W12, Platinum Listing, ATB Coin, and others, can be contacted at [email protected].
Advertisement
TopCryptoNewsinYourMailbox
TopCryptoNewsinYourMailbox